Lune Technical Analysis
An all-in-one TradingView indicator that maps market structure, liquidity, zones, and chart patterns on your chart.
Updated Jul 3, 2026
Overview#
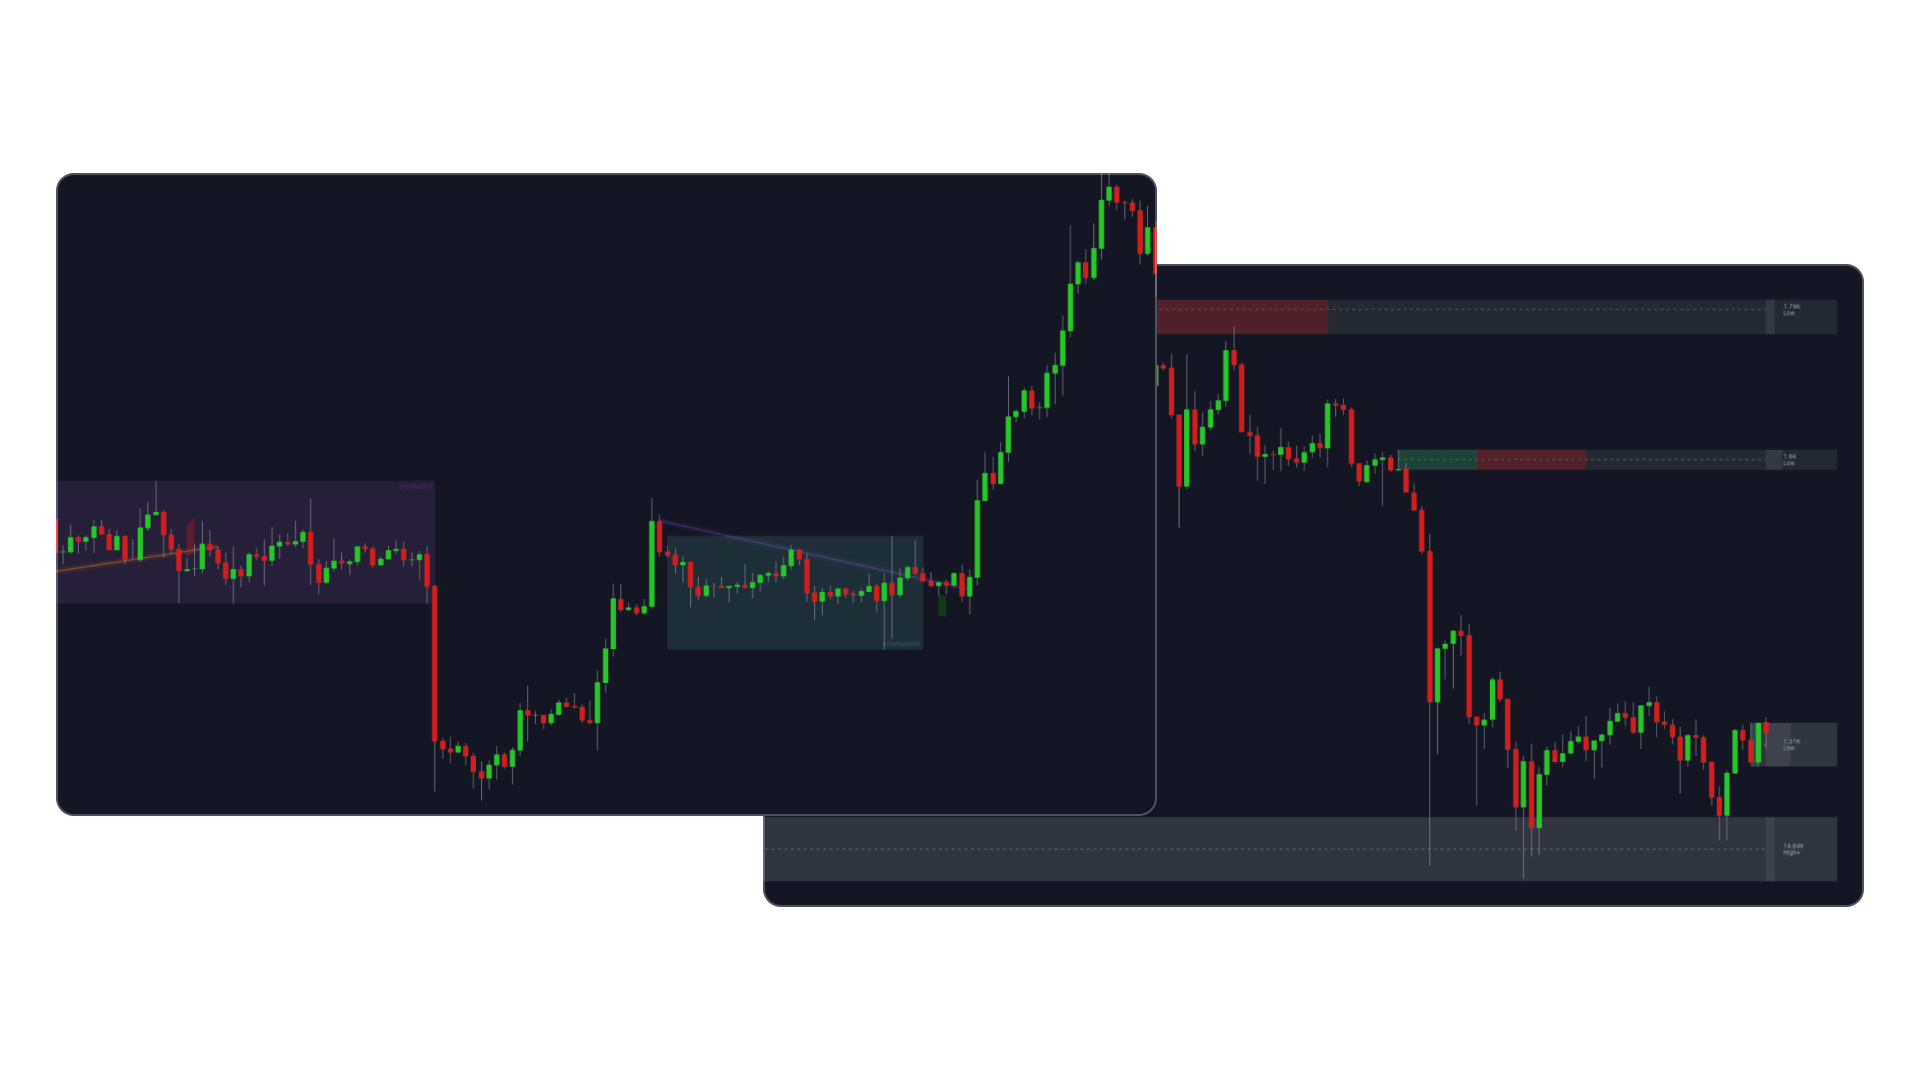
Lune Technical Analysis is a TradingView indicator that combines a set of chart-analysis tools in one place. It identifies patterns, levels, and zones on your chart and updates them as the market moves. The tools draw on common technical-analysis methods and adapt to current price action.
Key features#
- Market structure: Detects and displays market structure events, including Break of Structure (BoS) and Change of Character (ChoCh) across multiple timeframes to mark trend continuations and reversals.
- Liquidity analysis: A set of tools to visualize market liquidity, including Liquidity Bubbles (regular and trapped), Liquidity Grabs, Liquidity Waves, and Accumulation/Distribution Zones.
- Support and resistance: Identifies and scores support and resistance levels, then filters them to show the zones it ranks as most significant.
- Pattern detection: Detects and draws chart patterns such as triangles, wedges, and head and shoulders.
- Supply/demand and order blocks: Detects Supply/Demand zones and Order Blocks, including Breaker Blocks and mitigation tracking.
- Fair Value Gaps: Identifies Fair Value Gaps (FVGs) and their mitigations, including Inverse FVGs, to mark areas of price imbalance.
- Customizable visuals: Set candle coloring and custom colors.
Features#
Learn more about the tools in Lune Technical Analysis.
Candle coloring
Read more
Technical analysis
Read more
Liquidity analysis
Read more
Market structure
Read more
Order blocks
Read more
Supply demand zones
Read more
Support resistance
Read more
Fair value gaps
Read more
Alerts#
Learn how the built-in alert system lets you receive multiple TradingView alerts with a single alert.
Update logs#
See the changes, improvements, and bug fixes made to this indicator.
Update your indicator#
Learn how to update your TradingView indicator.
Was this page helpful?