Order Blocks
The Order Blocks feature automatically identifies and displays significant price zones where institutional buying or selling has likely occurred. These zones, known as order blocks
Overview#
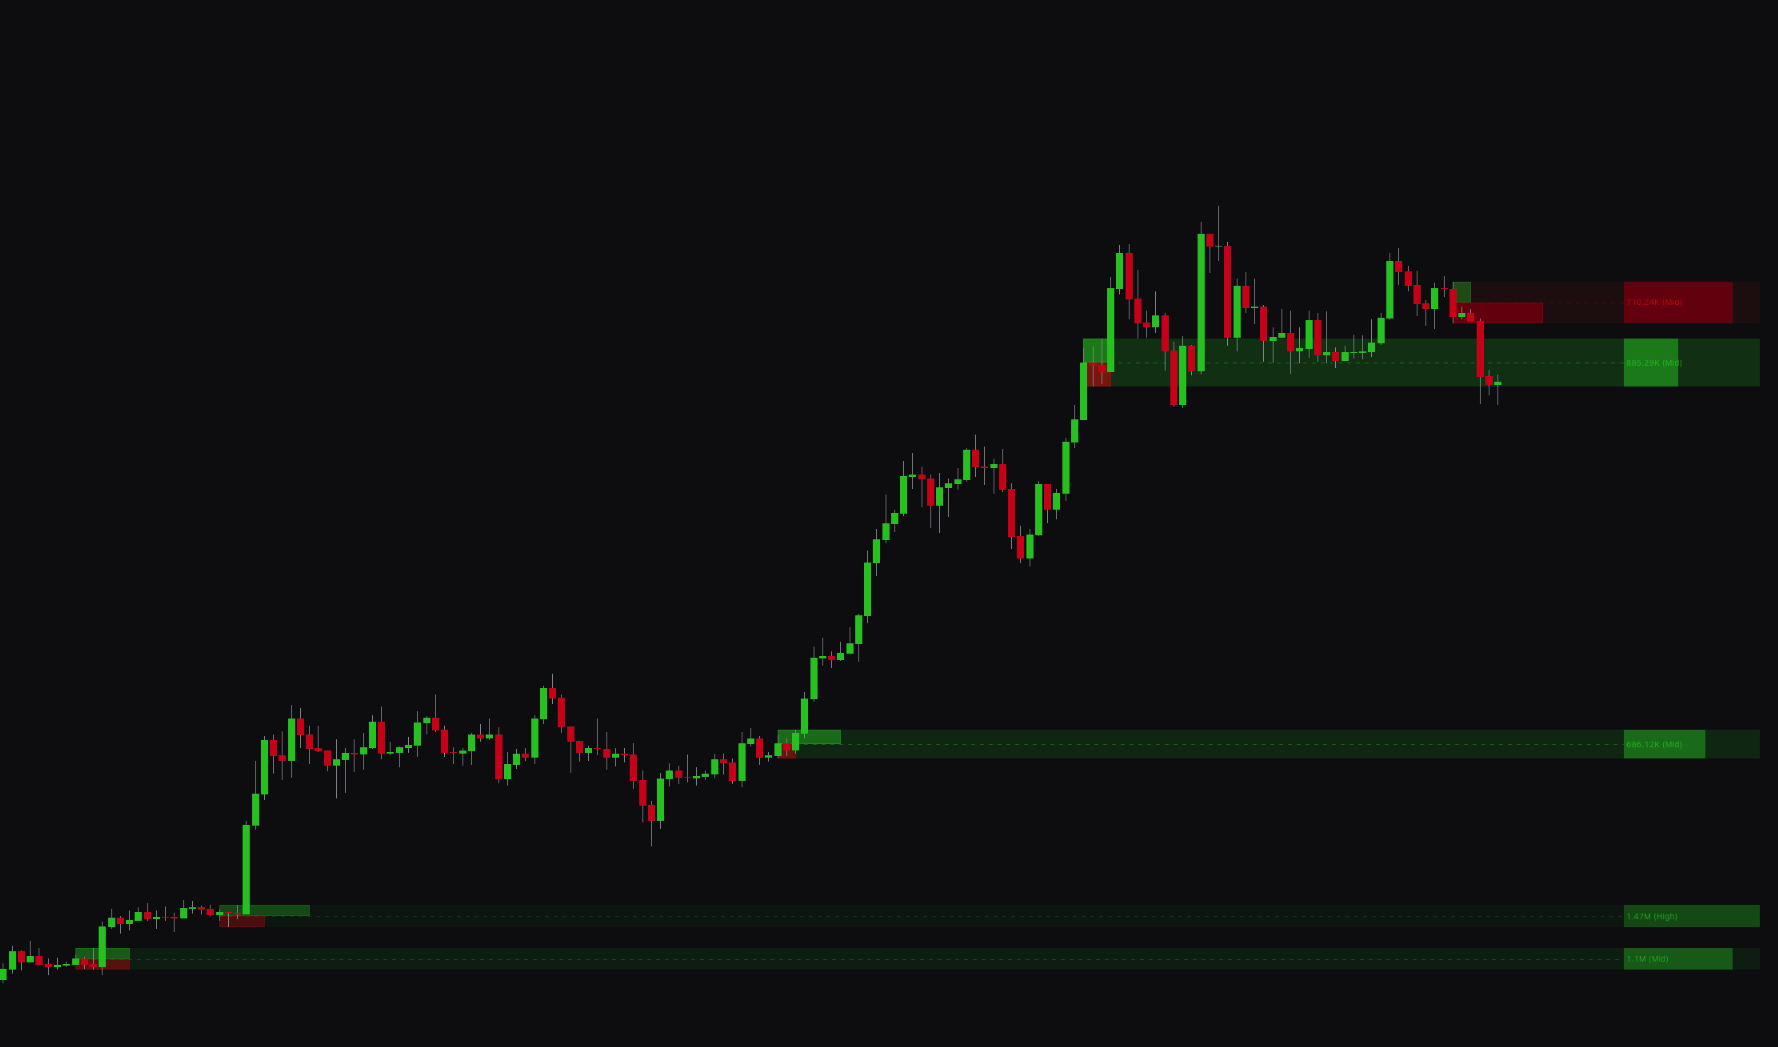
The Order Blocks feature automatically identifies and displays price zones where institutional buying or selling has likely occurred. These zones, known as order blocks, mark key areas of supply and demand. They often act as support or resistance levels where future price reversals may occur.
The indicator analyzes price action, volume, and order flow to detect these zones in real time. It also includes advanced features, such as Breaker Blocks, which show when an order block has been invalidated and is likely to act as the opposite. For example, a broken support level can become resistance.
Settings#
You can customize the Order Blocks detection to fit your analysis style, including setting up multiple timeframes and adjusting the visual display.
| Setting | Description |
|---|---|
| Length | Sets the lookback period for the order block detection. A lower number is more responsive to recent price action. A higher number focuses on more significant, longer-term zones. |
| Maximum Order Blocks | Limits the number of order blocks shown on the chart to keep your analysis clean and focused on the most relevant zones. |
| Order Blocks 1 & 2 | Lets you enable and configure up to two different timeframes for order block detection, enabling multi-timeframe analysis. |
| Strength Visuals | When enabled, the size of the order block boxes adjusts based on their significance, with larger boxes for stronger zones. |
| Volume Visuals | Displays volumetric bars and other visual cues within the order blocks to show the volume and order flow that formed the zone. |
| Hide Overlaps | When enabled, the indicator hides overlapping order blocks for a cleaner, less cluttered chart. |
| Breaker Blocks | When enabled, the indicator converts a mitigated (broken) order block into a breaker block, which often acts as a reversal zone. |
| Quality Filter | Enables a quality filter to remove lower-probability order blocks. You can set the Quality Filter Level to control how strict the filtering is. |
| Key Level | Displays a key price level within each order block. You can choose between the Half (midpoint) of the block or a Volume-based level. |
| Adaptive Transparency | When enabled, the transparency of the order blocks adjusts based on their significance. More significant blocks appear more solid and less transparent. |
| Show Text / Text Color | Controls the display, size, and color of the text labels within the order blocks. |
Best Practices & Usage#
- Identify key reversal zones: Order blocks help you spot potential reversals. A bullish order block can act as a support level where you might look for buying opportunities. A bearish order block can act as resistance for selling opportunities.
- Use multiple timeframes: Enable both Order Blocks 1 and Order Blocks 2 to view zones from different timeframes at once. A confluence of order blocks from multiple timeframes at the same price level marks a high-confidence zone.
- Watch for breaker blocks: A breaker block is a high-probability setup. For example, when a bullish order block (support) is broken and turns into a bearish breaker, it often acts as resistance for a continued move down.
- Filter for quality: For a cleaner, more focused analysis, keep the Quality Filter enabled. A level of 3 or higher works well for filtering out weaker zones.
- Confirm with other tools: Order blocks work best alongside other technical analysis tools. A buy signal from the main indicator that occurs within a bullish order block is a stronger confirmation than a signal in isolation.