Liquidity Analysis
The Liquidity Bubbles feature is designed to identify key moments of high volume and significant order flow, which often signal important price levels. The indicator detects two ty
Liquidity Bubbles#
Overview#
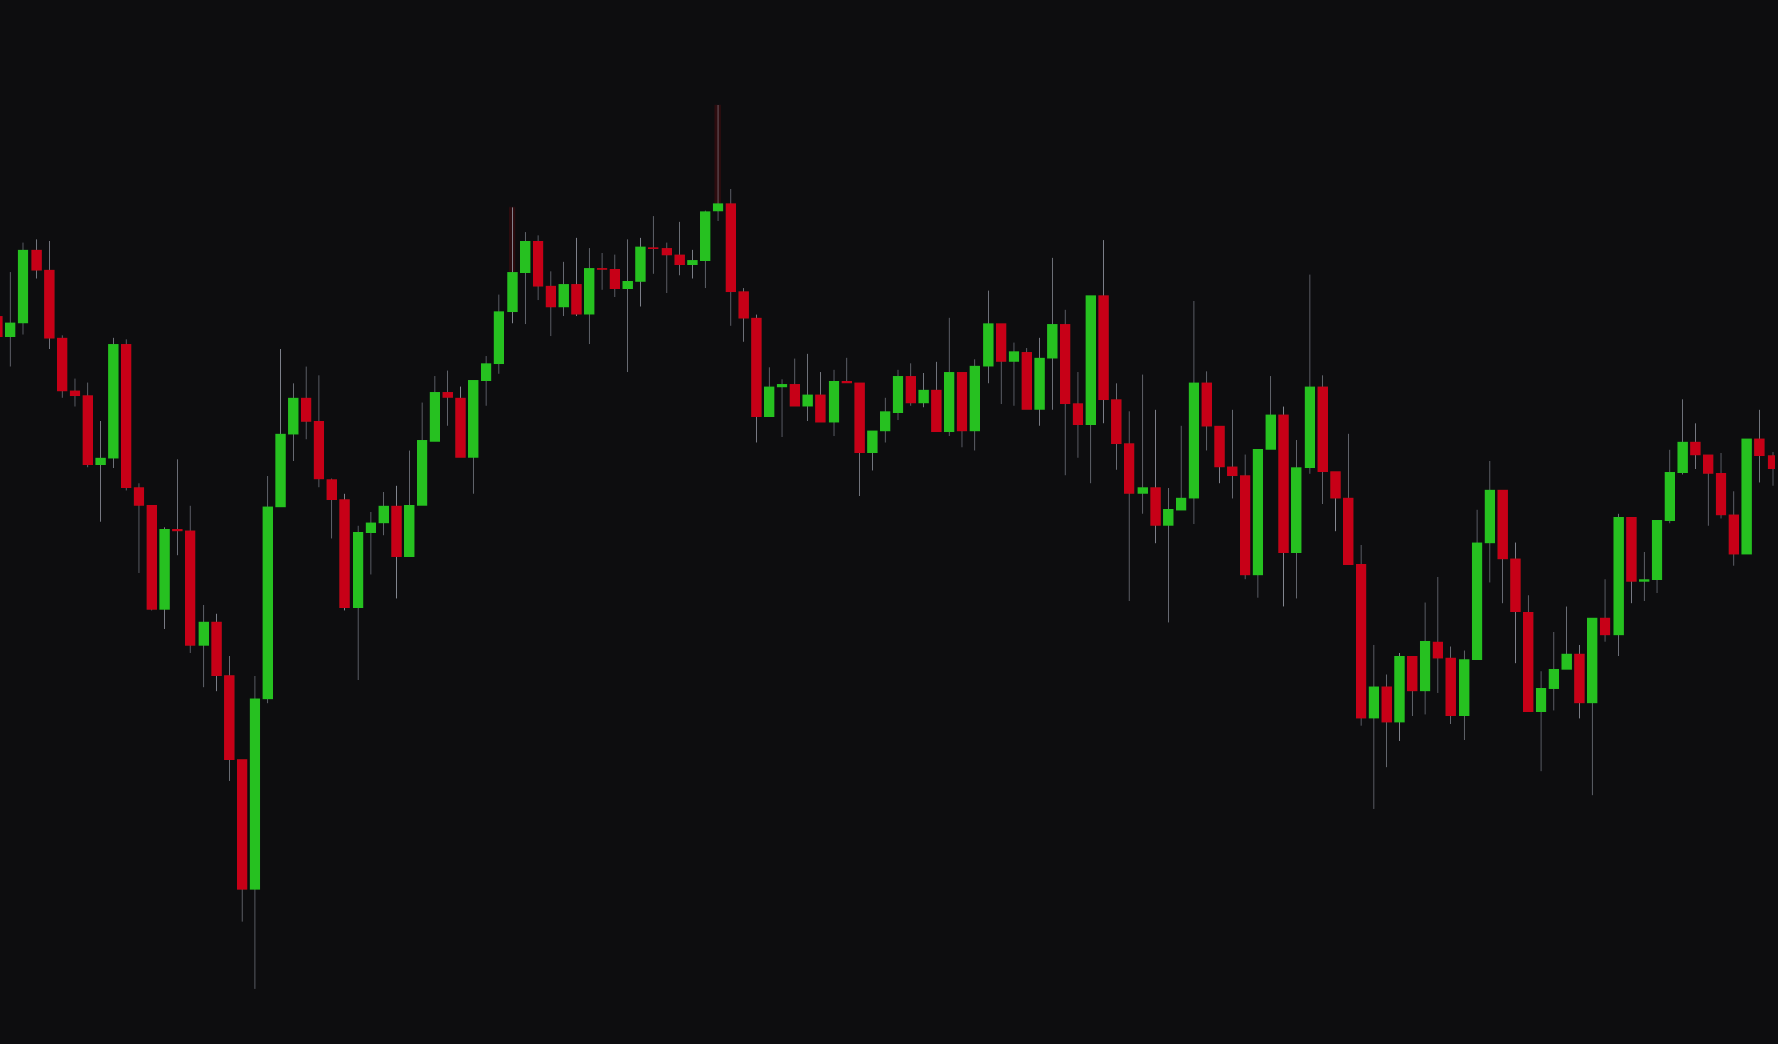
The Liquidity Bubbles feature identifies moments of high volume and order flow, which often signal important price levels. The indicator detects two types of bubbles:
- Regular Liquidity Bubbles: these appear when price direction, volume, and order flow (delta) agree. A bullish bubble suggests strong buying pressure at a key low, while a bearish bubble indicates strong selling pressure at a key high.
- Trapped Liquidity Bubbles: these signals identify areas where traders may have been "trapped" on the wrong side of the market. A bullish trap bubble appears when price closes high after significant selling pressure near the lows, suggesting sellers are trapped. A bearish trap bubble appears when price closes low after strong buying pressure near the highs, suggesting buyers are trapped.
These bubbles are plotted on the chart to give a clear visual cue of potential support, resistance, or reversal zones.

Settings#
You can customize the detection sensitivity for both regular and trapped liquidity bubbles to fit your analysis style.
Regular Liquidity Bubbles#
| Setting | Description |
|---|---|
| Regular Liquidity Bubbles | Enables or disables the detection of standard liquidity bubbles. |
| Sensitivity | Controls how sensitive the algorithm is for detecting regular bubbles. A lower number is less sensitive and requires stronger signals, while a higher number detects weaker signals more often. |
| Bullish/Bearish Color | Sets the colors for the bullish and bearish regular liquidity bubbles. |
| Adaptive Transparency | When enabled, the transparency of the bubbles adjusts based on their significance. More significant bubbles appear more solid. |
Trapped Liquidity Bubbles#
| Setting | Description |
|---|---|
| Trapped Liquidity Bubbles | Enables or disables the detection of trapped liquidity bubbles. |
| Sensitivity | Controls the detection sensitivity for trapped liquidity bubbles. A lower number requires stronger trapping signals, while a higher number is more sensitive. |
| Bullish/Bearish Color | Sets the colors for the bullish and bearish trapped liquidity bubbles. |
| Adaptive Transparency | When enabled, the transparency of the trapped bubbles adjusts based on their significance. |
Best practices and usage#
- Use bubbles as confirmation: liquidity bubbles are confirmation signals. A regular buy signal that appears at the same time as a bullish liquidity bubble is a higher-confidence setup.
- Identify key zones: areas with a cluster of bubbles often mark support or resistance zones where large volumes have traded.
- Watch for trapped traders: trap bubbles can point to a potential reversal, since they signal that one side of the market has been overpowered. For example, a bearish trap bubble at a key high suggests buyers have been exhausted and sellers are taking control.
Liquidity Grabs#
Overview#
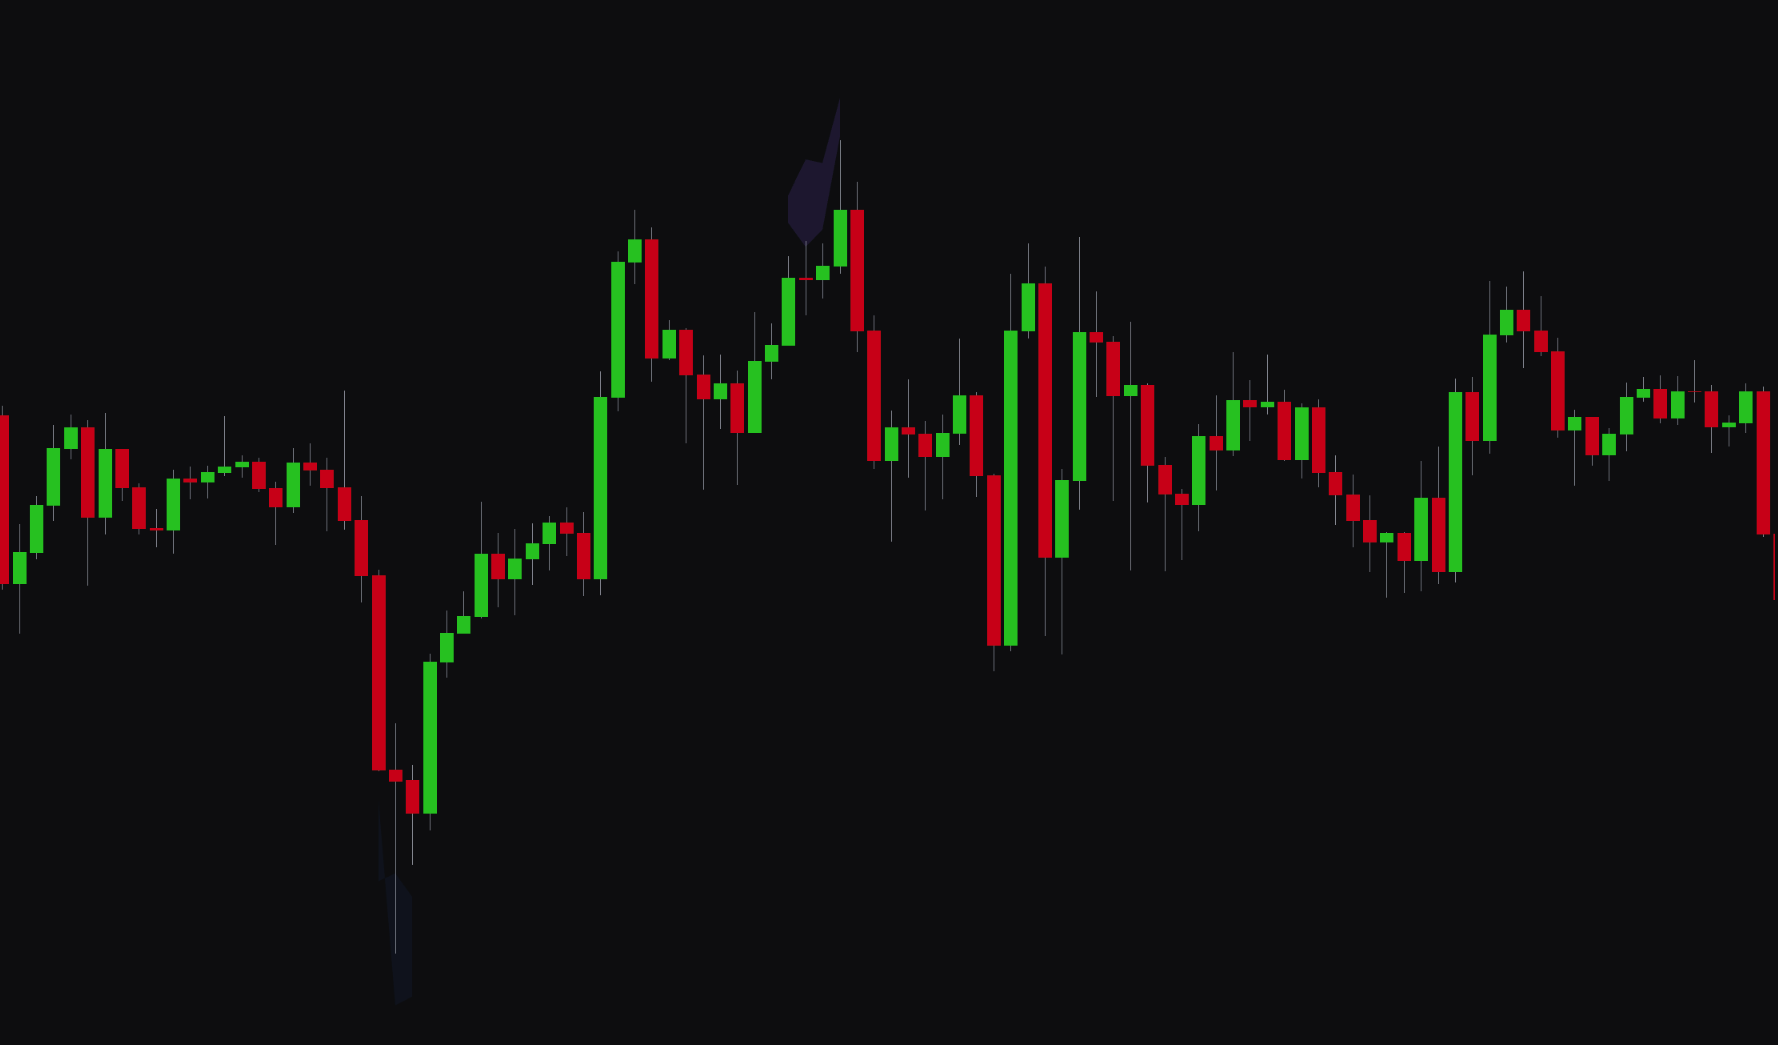
The Liquidity Grabs feature detects and shows where price makes a sharp move to "grab" liquidity resting above or below recent swing highs or lows. This often happens when institutional traders push price to trigger stop-loss orders before reversing in the intended direction.
The indicator highlights these events with a candle overlay and a wick zone, showing you where the liquidity grab occurred.
Settings#
You can enable or disable the Liquidity Grabs feature and adjust its sensitivity to filter for the most significant events.
| Setting | Description |
|---|---|
| Liquidity Grabs | Enables or disables the detection of liquidity grabs. |
| Sensitivity | Controls how sensitive the algorithm is for detecting liquidity grabs. A lower number is less sensitive and shows only the most significant grabs, while a higher number detects smaller ones. |
| Bullish/Bearish Color | Sets the colors for bullish and bearish liquidity grab candles. |
| Adaptive Transparency | When enabled, the transparency of the grab candle adjusts based on its significance. |
Best practices and usage#
- Spot fakeouts: liquidity grabs are often fakeouts. A bullish liquidity grab happens when price briefly drops below a key low (grabbing sell-side liquidity) before quickly reversing to the upside. This can be an entry signal for long trades.
- Confirm with other tools: a liquidity grab that occurs at a key support or resistance level or supply/demand zone is a stronger signal.
- Adjust sensitivity to reduce noise: in choppy markets, use a lower sensitivity setting to filter out minor grabs and focus on the most significant ones.
Liquidity Waves#
Overview#
The Liquidity Waves feature visualizes buying and selling pressure through volume spread analysis (VSA). It plots colored waves on your chart to show a significant imbalance between buying and selling activity, suggesting a potential continuation or reversal.
- Bullish Waves (Blue): appear below the price and signal strong buying pressure or demand.
- Bearish Waves (Purple): appear above the price and signal strong selling pressure or supply.
Settings#
You can customize the sensitivity of the Liquidity Waves to match your trading style and market conditions.
| Setting | Description |
|---|---|
| Liquidity Waves | Enables or disables the Liquidity Waves visualization. |
| Sensitivity | Controls the sensitivity of the wave detection algorithm. A lower value is less sensitive and requires stronger signals, while a higher value detects weaker signals more often. |
| Bullish/Bearish Color | Sets the colors for the bullish and bearish waves. |
| Adaptive Transparency | When enabled, the transparency of the waves adjusts based on the strength of the signal. |
Best practices and usage#
- Confirm trend strength: in an uptrend, bullish waves confirm strong buying interest and suggest the trend is likely to continue. The opposite is true for bearish waves in a downtrend.
- Spot absorption: if price is falling but bullish waves start to appear, it can be a sign that buyers are absorbing the selling pressure, which often precedes a reversal to the upside.
- Use with other tools: Liquidity Waves work best when they confirm signals from other tools. For example, a buy signal combined with a strong bullish wave gives a high-confidence entry.
Accumulation/Distributions#
Overview#
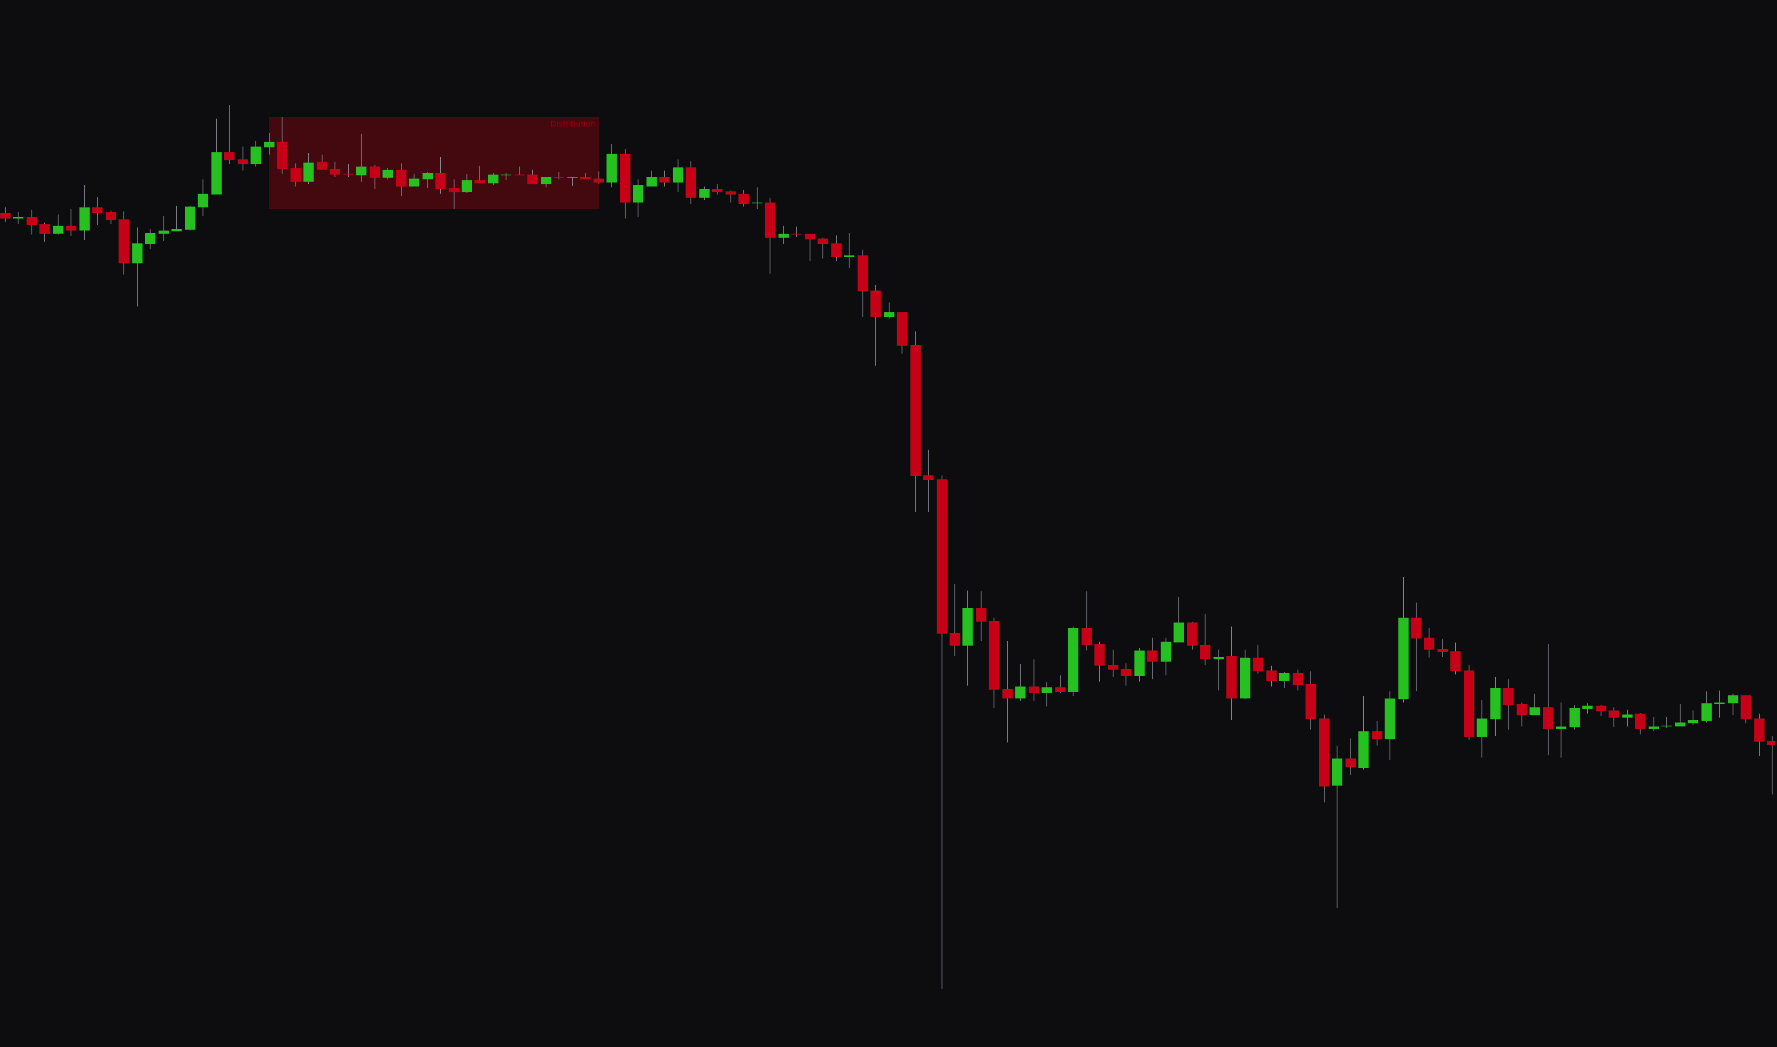
The Accumulation/Distributions feature identifies and draws zones on your chart where institutional traders may be accumulating (buying) or distributing (selling) large positions. These zones are detected using an analysis of volume, order flow, and price action.
- Accumulation Zone (Green): a period of quiet buying, often preceding a move up.
- Distribution Zone (Red): a period of quiet selling, often preceding a move down.
This tool helps you spot the "smart money" footprint and position yourself for large market moves.
Settings#
You can customize the appearance and display of the Accumulation/Distribution zones.
| Setting | Description |
|---|---|
| Accumulation/Distributions | Enables or disables the detection of accumulation and distribution zones. |
| Bullish/Bearish Color | Sets the colors for the accumulation (bullish) and distribution (bearish) zones. |
| Adaptive Transparency | When enabled, the transparency of the zones adjusts based on their significance. |
| Show Text / Text Color | Controls the display and color of the text labels for the zones. |
Best practices and usage#
- Trade with the trend: after an accumulation zone, look for bullish trading opportunities. After a distribution zone, look for bearish ones.
- Use zones as support/resistance: once an accumulation zone has led to a breakout, it often acts as a support level on later pullbacks. A distribution zone can act as resistance.
- Be patient: accumulation and distribution can take time. These zones work best on higher timeframes (for example, 1-hour and above) to identify major, long-term opportunities.