Market Structure
The Market Structure feature automatically identifies and displays key structural points on your chart, helping you to understand the underlying trend and spot potential shifts in
Market Structure#
Overview#
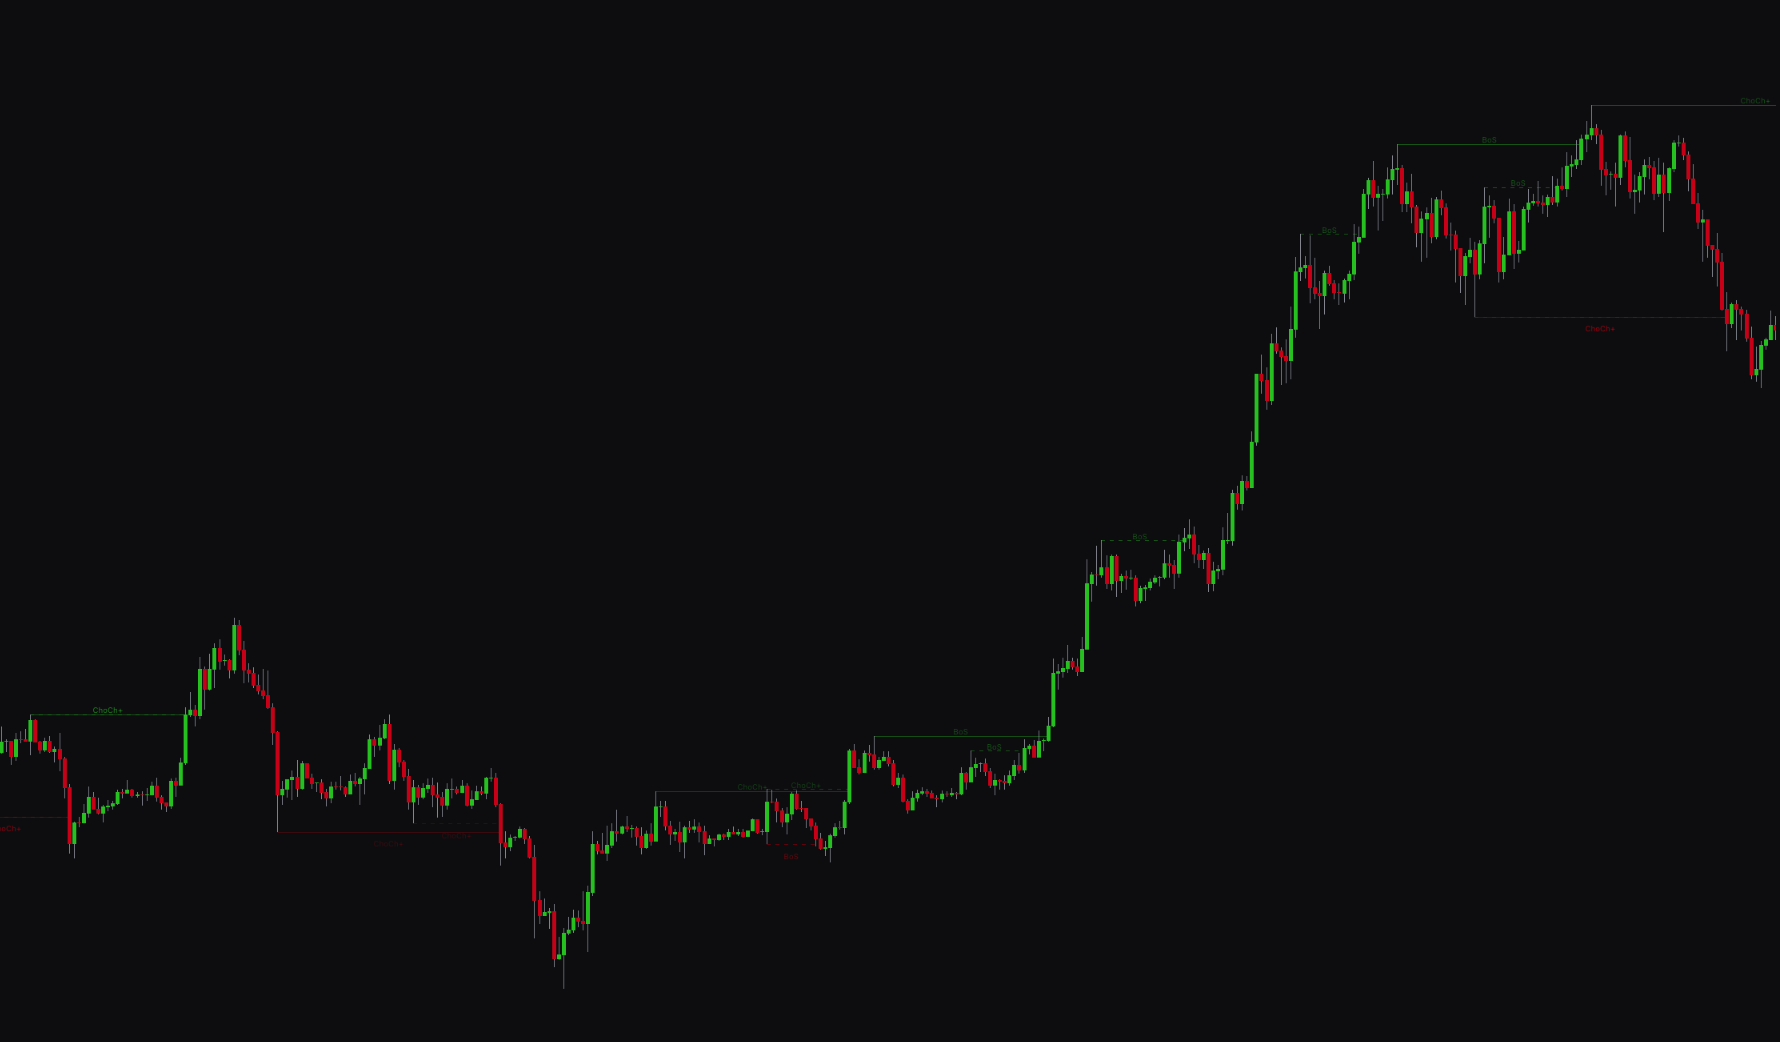
The Market Structure feature finds and displays key structural points on your chart. It helps you understand the underlying trend and spot potential shifts in momentum. It detects two primary types of market structure events:
- Break of Structure (BoS): Occurs when the price continues in the direction of the current trend by breaking a previous high (in an uptrend) or low (in a downtrend). This signals trend continuation.
- Change of Character (ChoCh): Occurs when the price breaks the most recent market structure against the current trend, signaling a potential reversal.
The indicator also adds a "+" sign (for example, "BoS+" or "ChoCh+") to these labels to mark a high-volume break. This shows the move is backed by significant market interest.
This tool analyzes price action on both short-term and long-term bases, giving you a multi-dimensional view of the market's structure.
Settings#
You can set up the Market Structure detection to focus on the timeframes most relevant to your trading style.
| Setting | Description |
|---|---|
| Short-term | Turns on short-term market structure analysis and sets the lookback Length for detecting pivots. |
| Long-term | Turns on long-term market structure analysis and sets the lookback Length for detecting pivots. |
| Adaptive Transparency | When on, the lines and labels for market structure breaks adjust their transparency based on significance. |
| Show Text / Text Color | Sets the visibility, size, and color of the text labels (for example, "BoS," "ChoCh+"). |
| Bullish/Bearish Color | Sets the colors for bullish (uptrend) and bearish (downtrend) structure lines for both short-term and long-term analysis. |
Best Practices & Usage#
- Confirm trend direction: Use a series of bullish BoS signals to confirm an uptrend, or bearish BoS signals to confirm a downtrend. A break labeled with a "+" shows the move happened on high volume, adding extra confirmation to the trend's strength.
- Spot potential reversals: A ChoCh signal against the prevailing trend is often one of the earliest signs the market may reverse. A ChoCh+ is a higher-confidence reversal signal because it is backed by significant volume.
- Combine timeframes: Look for confirmation across both short-term and long-term structures. A short-term bullish ChoCh+ followed by a long-term bullish BoS+ is a high-confidence signal that a new uptrend is underway.
- Adjust Length for your style:
- Day traders may prefer a shorter Length for the short-term structure to see more immediate shifts.
- Swing traders should focus on the long-term structure with a larger Length to identify major trend changes.
Equal Highs/Lows#
Overview#
The Equal Highs/Lows feature detects and highlights areas where the price has formed two or more swing highs or lows at a similar level. These patterns often show a buildup of liquidity and can point to market reversals before they happen.
The detection is based on a specific set of conditions that identify true swing points with dominant wicks, followed by confirming price action.
- Equal Highs (EQH): A resistance level where buying pressure has failed multiple times, confirmed by bearish price action. This often precedes a bearish reversal.
- Equal Lows (EQL): A support level where selling pressure has failed multiple times, confirmed by bullish price action. This often precedes a bullish reversal.
Settings#
You can turn the detection of Equal Highs and Lows on or off and set their appearance.
| Setting | Description |
|---|---|
| Show Equal Highs/Lows | Turns the detection and display of these patterns on or off. |
| Bullish/Bearish Color | Sets the colors for the Equal Lows (bullish) and Equal Highs (bearish) lines. |
Best Practices & Usage#
- Watch for reversals: The formation of Equal Highs can warn that buying momentum is fading and a bearish reversal is likely. Equal Lows can signal that selling pressure is weakening and a bullish reversal may be near.
- Identify liquidity zones: Equal highs and lows are key liquidity areas. Often, the price will eventually break through these levels in a sharp move known as a liquidity grab.
- Use as support and resistance: Until they are broken, EQH and EQL levels act as resistance and support. A reversal signal at one of these levels is a high-confidence setup.
- Look for breakout opportunities: A breakout above an EQH level can signal a bullish move, while a breakdown below an EQL level can signal a bearish move.