Supply/Demand Zones
The Supply/Demand Zones feature automatically identifies and displays key price areas where strong buying or selling pressure has historically occurred. These zones represent signi
Updated Jul 3, 2026
Overview#
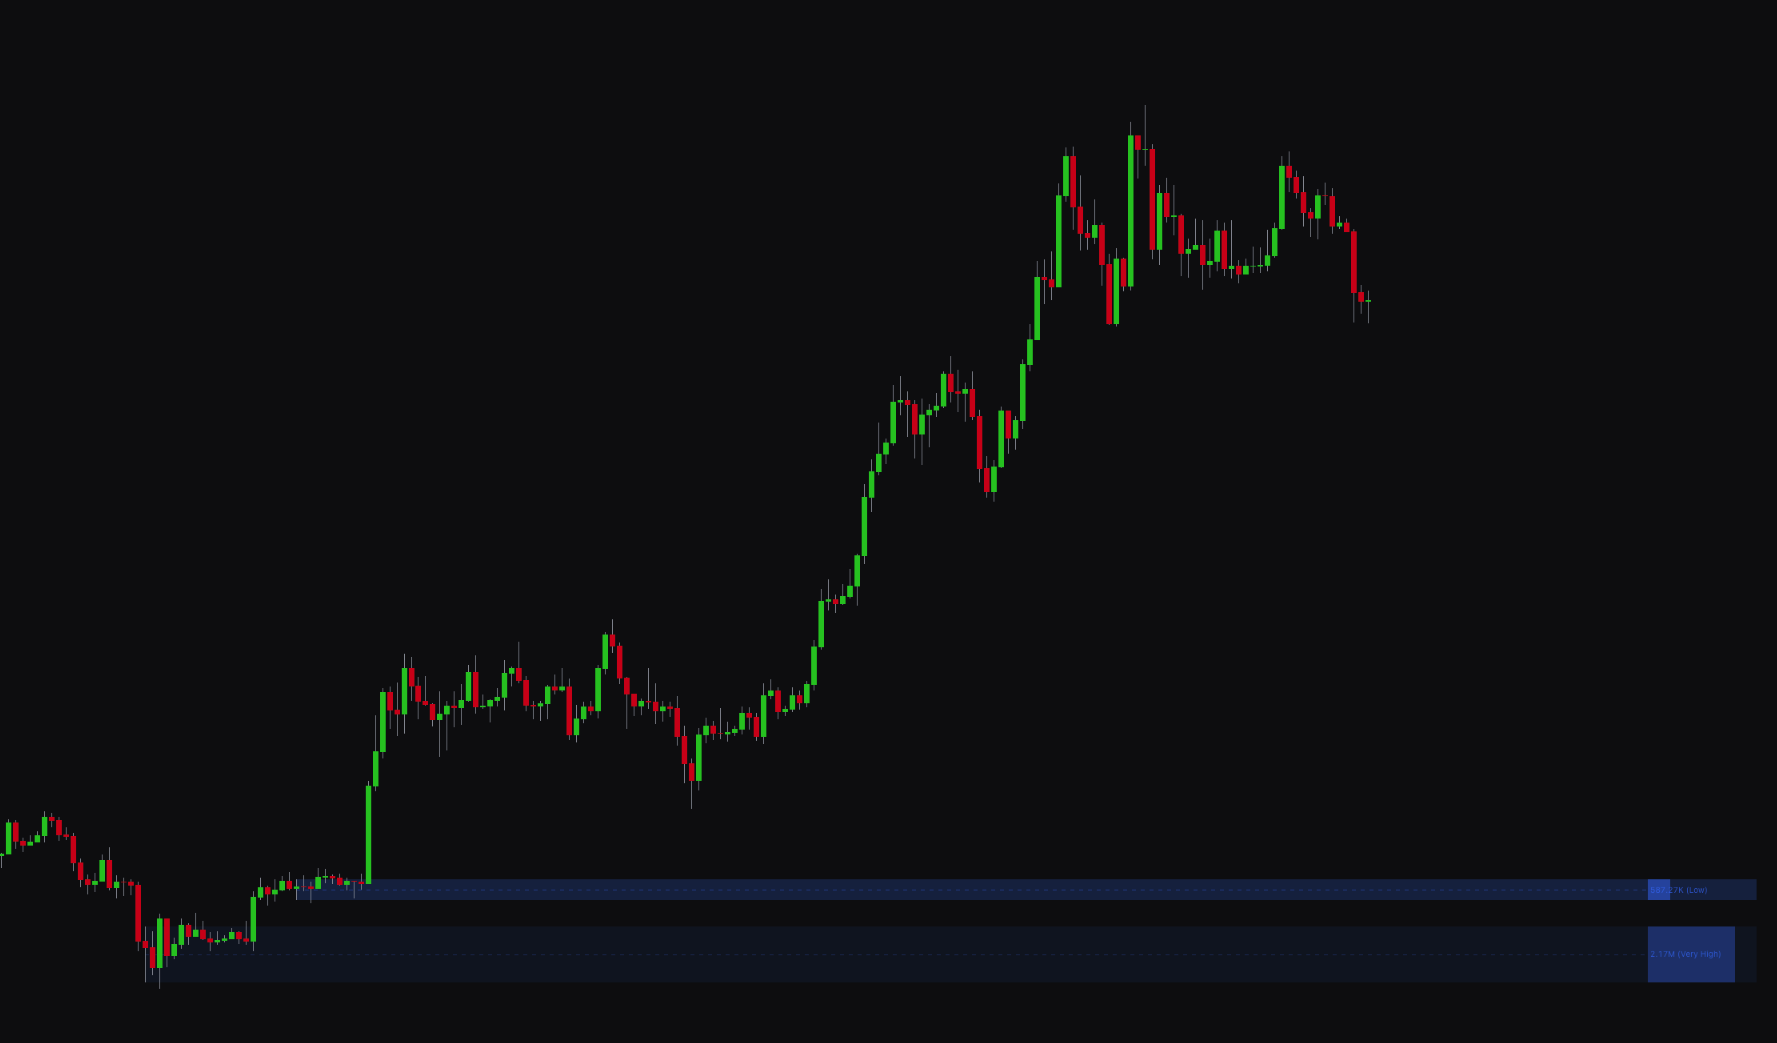
The Supply/Demand Zones feature automatically finds and displays key price areas where strong buying or selling pressure has occurred. These zones mark levels of supply (resistance) and demand (support), and often act as areas of future price reversals.
The indicator uses a dual-system approach to detect these zones. It analyzes volume, order flow (delta), and price action to find the most significant levels.
Settings#
You can customize the Supply/Demand Zones detection to fit your analysis style, with options for multi-timeframe analysis and visual filtering.
| Setting | Description |
|---|---|
| Length | Sets the lookback period for the zone detection algorithm. A lower number is more responsive to recent price action, while a higher number focuses on longer-term zones. |
| Maximum Supply/Demand Zones | Limits the number of zones shown on the chart to keep your analysis focused on the most relevant levels. |
| Supply/Demand Zones 1 & 2 | Lets you enable and configure up to two timeframes for zone detection, for multi-timeframe analysis. |
| Strength Visuals | When enabled, the size of the zone boxes adjusts based on significance, with larger boxes for stronger zones. |
| Hide Overlaps | When enabled, the indicator hides overlapping zones for a cleaner chart. |
| Quality Filter | Enables a filter to remove lower-probability zones. Set the Quality Filter Level to control how strict the filtering is. |
| Key Level | Displays a key price level within each zone. Choose between the Half (midpoint) of the zone or a Volume-based level. |
| Adaptive Transparency | When enabled, the transparency of the zones adjusts based on significance. More significant zones appear more solid. |
| Show Text / Text Color | Controls the display, size, and color of the text labels within the zones. |
Best practices and usage#
- Identify reversal zones: Supply and demand zones help you spot potential market reversals. Look for buying opportunities in demand zones (support) and selling opportunities in supply zones (resistance).
- Use multiple timeframes: For higher-confidence setups, enable both Supply/Demand Zones 1 and Supply/Demand Zones 2 to look for a confluence of zones at the same price level.
- Filter for quality: Keep the Quality Filter enabled with a level of 3 or higher. This helps filter out weaker zones so you focus on the most significant areas.
- Combine with other analysis: Supply and demand zones work best as a confirmation tool. A buy signal from the main indicator that occurs within a strong demand zone is a higher-probability setup than a signal in isolation.
Was this page helpful?