Technical Analysis
The Pattern Detection feature automatically identifies and displays common chart patterns on your chart. This tool helps you spot potential trading opportunities based on well-know
Pattern Detection#
Overview#
The Pattern Detection feature automatically identifies and displays common chart patterns on your chart. This tool helps you spot potential trading opportunities based on well-known technical formations like triangles, wedges, and head & shoulders.
By automating the detection process, this feature saves you time and helps ensure you don't miss key patterns as they develop.
Supported Chart Patterns#
Settings#
You can configure the Pattern Detection feature to match your preferred trading timeframe and display preferences.
| Setting | Description |
|---|---|
| Pattern Detection | Enables the pattern detection algorithm and lets you set the analysis timeframe to Short-term, Mid-term, or Long-term. |
| Display Past Patterns | When enabled, previously detected patterns will remain visible on your chart for historical analysis. |
| Show Text | Controls the size of the text labels that identify each pattern. |
| Text Color | Sets the color of the pattern labels. |
| Pattern Colors | Lets you customize the colors used to draw the different types of patterns. |
Best Practices & Usage#
- Match Timeframe to Your Strategy:
- Use Short-term for day trading to find patterns that resolve quickly.
- Use Mid-term for a balanced approach suitable for most trading styles.
- Use Long-term for swing or position trading to identify major, high-confidence patterns.
- Use for Confirmation: Combine detected patterns with other indicators or analysis techniques to confirm your trade ideas. A pattern that forms at a key support or resistance level is often more significant.
- Keep an Eye on Incomplete Patterns: The indicator will draw patterns in an "incomplete" color as they form. This can give you an early heads-up to a potential setup.
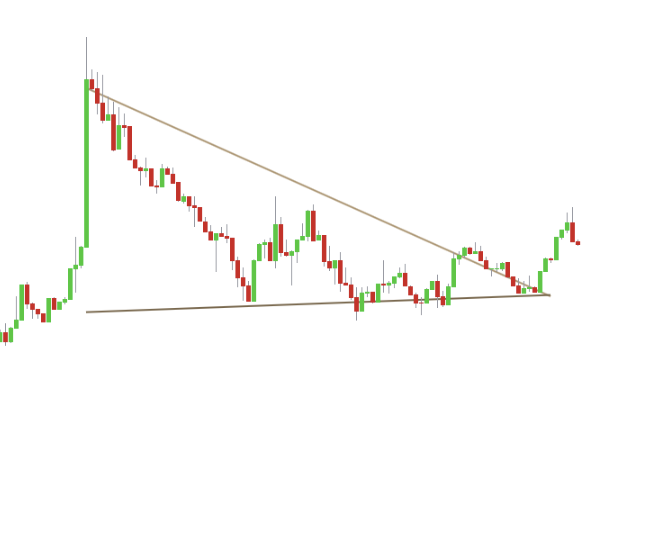
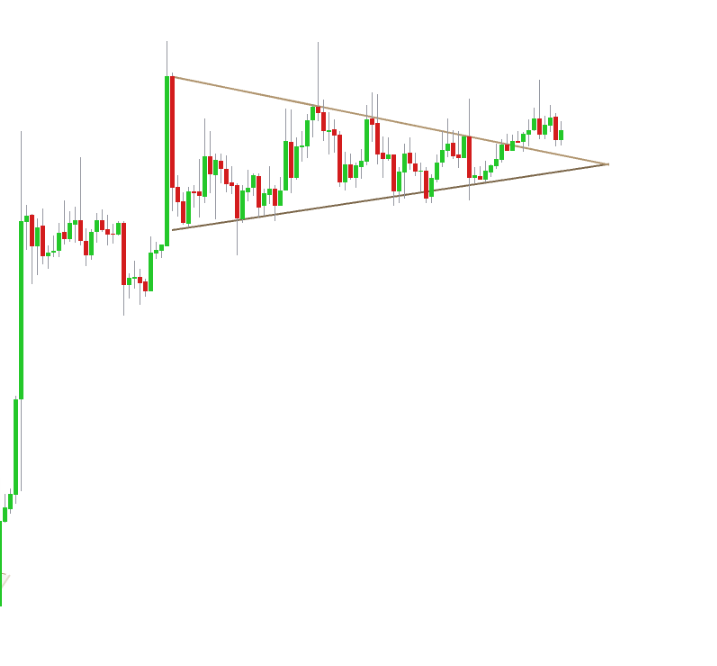
Examples#
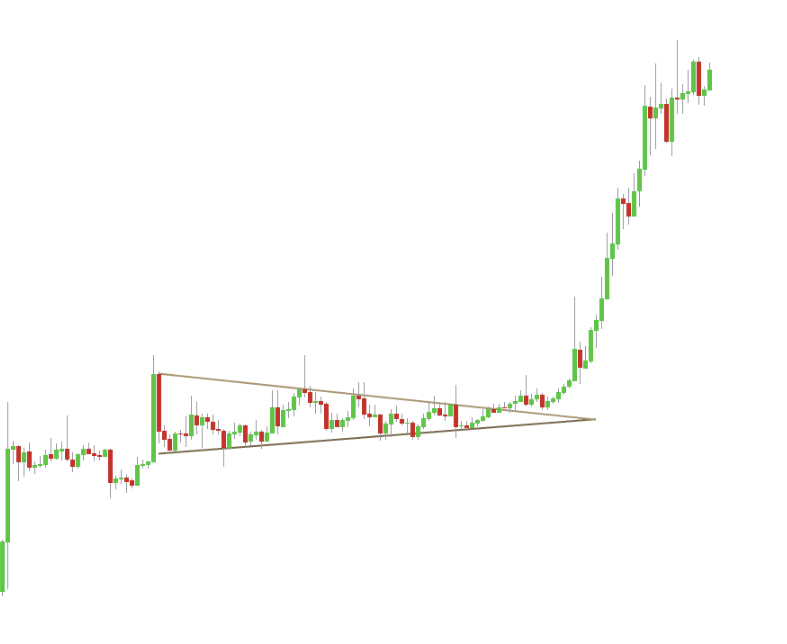
| Before | After |
|---|---|
| A Symmetrical Triangle is detected and recognized, the price broke above it which is a bullish indication. |
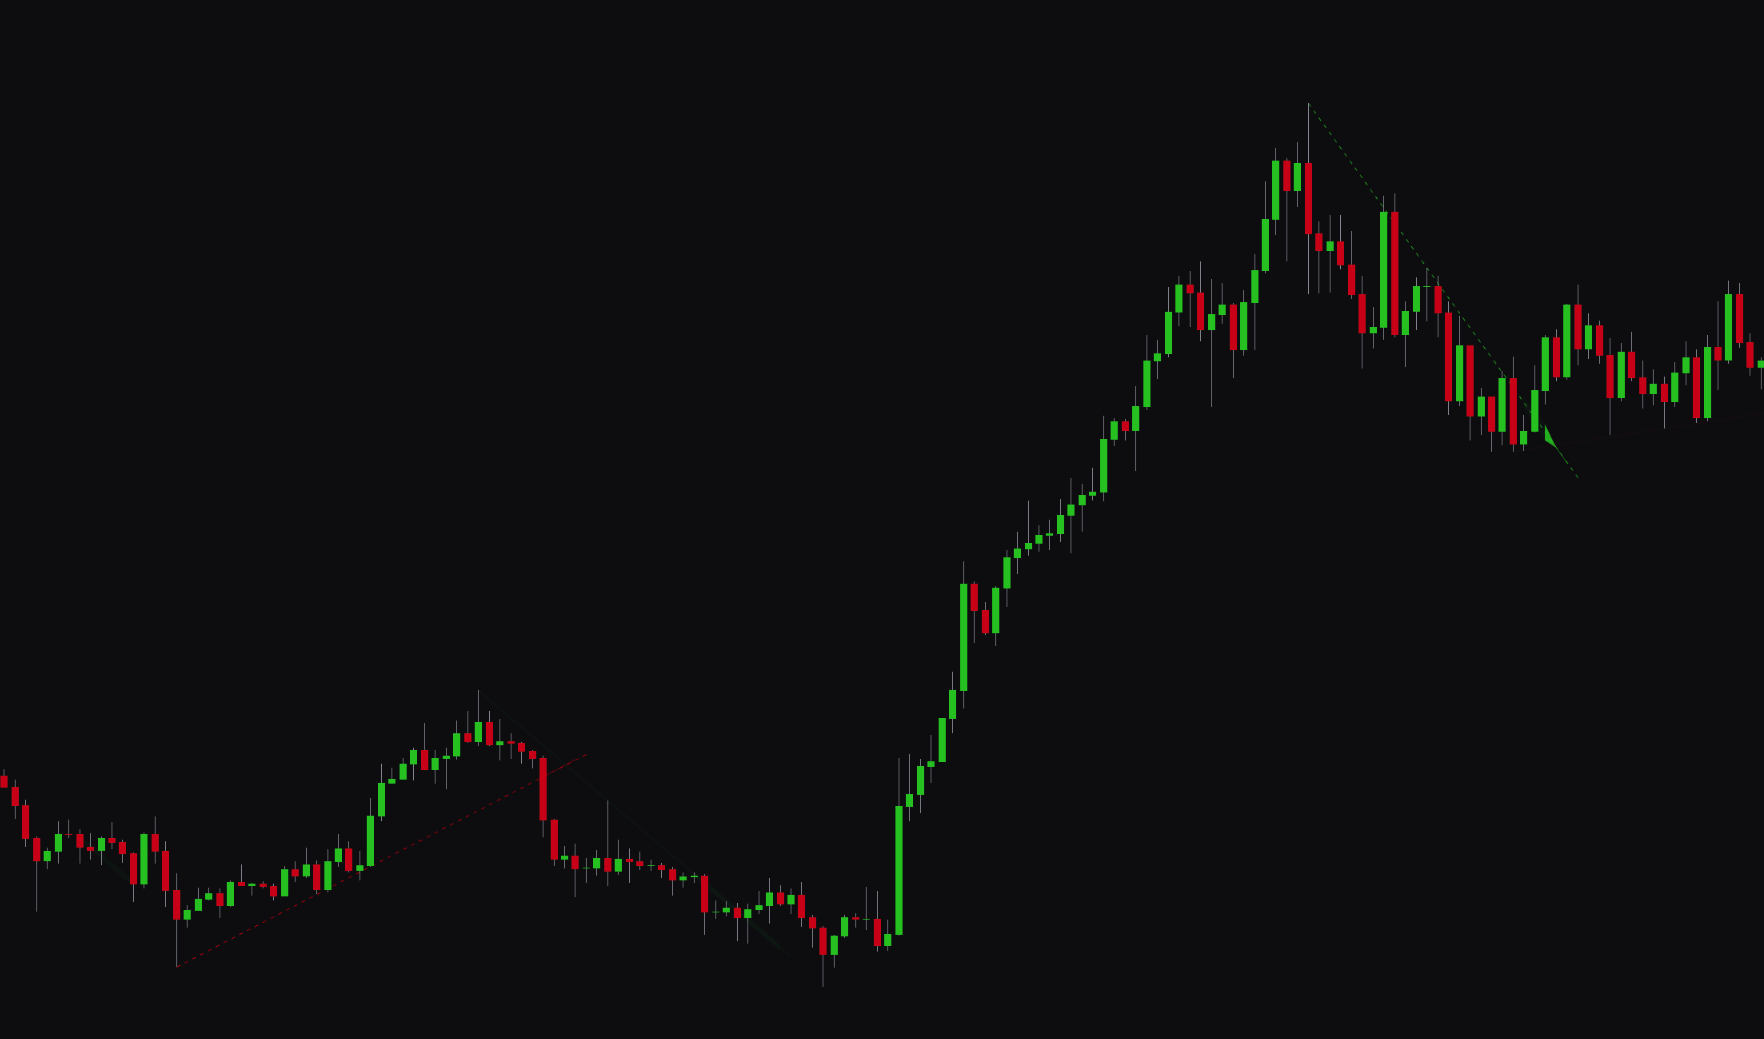
Trendlines Detection#
Overview#
The Trendlines Detection feature uses an algorithm to automatically identify and draw significant trendlines on your chart. This tool helps you visualize the market's structure and identify key areas of dynamic support and resistance without manual drawing.
The indicator also includes an Adaptive Transparency feature, which makes more significant and well-established trendlines appear more solid, while newer or weaker trendlines are more transparent.
Settings#
You can configure the Trendlines Detection feature to fit your analysis style.
| Setting | Description |
|---|---|
| Trendlines Detection | Enables the trendline detection and lets you set the analysis timeframe to Short-term, Mid-term, or Long-term. |
| Liquidity Calculations | When enabled, the algorithm will include volume-based liquidity analysis to identify more robust and significant trendlines. |
| Adaptive Transparency | When enabled, the transparency of the trendlines will dynamically adjust based on their significance. |
| Trendline Colors | Lets you customize the colors for bullish (uptrend) and bearish (downtrend) trendlines. |
Best Practices & Usage#
- Identify Dynamic Support and Resistance: Use the automatically drawn trendlines to spot key levels where the price may bounce or reverse.
- Confirm Trend Strength: A long, well-respected trendline with multiple touches is a strong indicator of the market's primary direction.
- Spot Trend Breaks: A decisive price close across a major trendline can signal a shift in market momentum and a potential trading opportunity.
- Enable Liquidity Calculations: For more reliable trendlines, keep the Liquidity Calculations setting enabled, as it helps the algorithm focus on levels with significant market interest.