Dashboard
The Dashboard is a real-time display that provides an at-a-glance summary of the key market metrics analyzed by the Lune Market Analysis indicator. It condenses complex data into a
Overview#
The Dashboard is a real-time display that summarizes the key market metrics analyzed by the Lune Market Analysis indicator. It condenses complex data into a simple, easy-to-read panel on your chart, helping you quickly assess the current market environment.
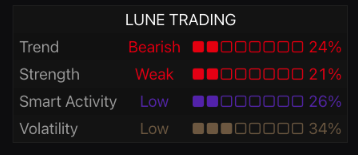
The dashboard tracks four dimensions of the market: Trend, Strength, Smart Activity, and Volatility. Each metric has a status and a score, so you can gauge market conditions without interpreting several tools.
Settings#
You can customize the appearance and location of the dashboard to fit your chart layout.
| Setting | Description |
|---|---|
| Dashboard | Enables the dashboard and sets its position on the chart. |
| Dashboard Size | Adjusts the text and overall size of the dashboard for better readability. |
| Dashboard Orientation | Sets the layout of the dashboard to either a wide Horizontal format or a tall Vertical format. |
Metrics Explained#
The dashboard shows four metrics, each with a descriptive status and a progress bar that reflects its underlying score.
| Metric | Description | |
|---|---|---|
| Trend | Measures the dominant market direction. The status will show | Bullish, Bearish, or Ranging. |
| Strength | Analyzes the persistence and conviction behind the current trend. The status will show | Strong, Weak, or Average. |
| Smart Activity | Detects the presence of institutional or smart money order flow. The status will show | High, Low, or Neutral activity. |
| Volatility | Measures the current level of price volatility. The status will show | High, Medium, or Low. |
Best Practices & Usage#
- Quick market assessment: Use the dashboard at the start of your trading session to get a quick read of the current market environment.
- Confirm conditions: Look for agreement across metrics. For example, a bullish trend with strong strength and high smart activity can point to a high-confidence long setup.
- Risk management: A high volatility reading can serve as a warning to reduce position sizes or tighten stop losses.
- Layout customization: Choose the Vertical orientation if you have limited horizontal space, or use the Horizontal layout for a more compact view.