AI Volume Profile
The AI Volume Profile is a specialized institutional tool that provides a butterfly style visualization of volume distribution across price levels. Unlike traditional volume profil
Overview#
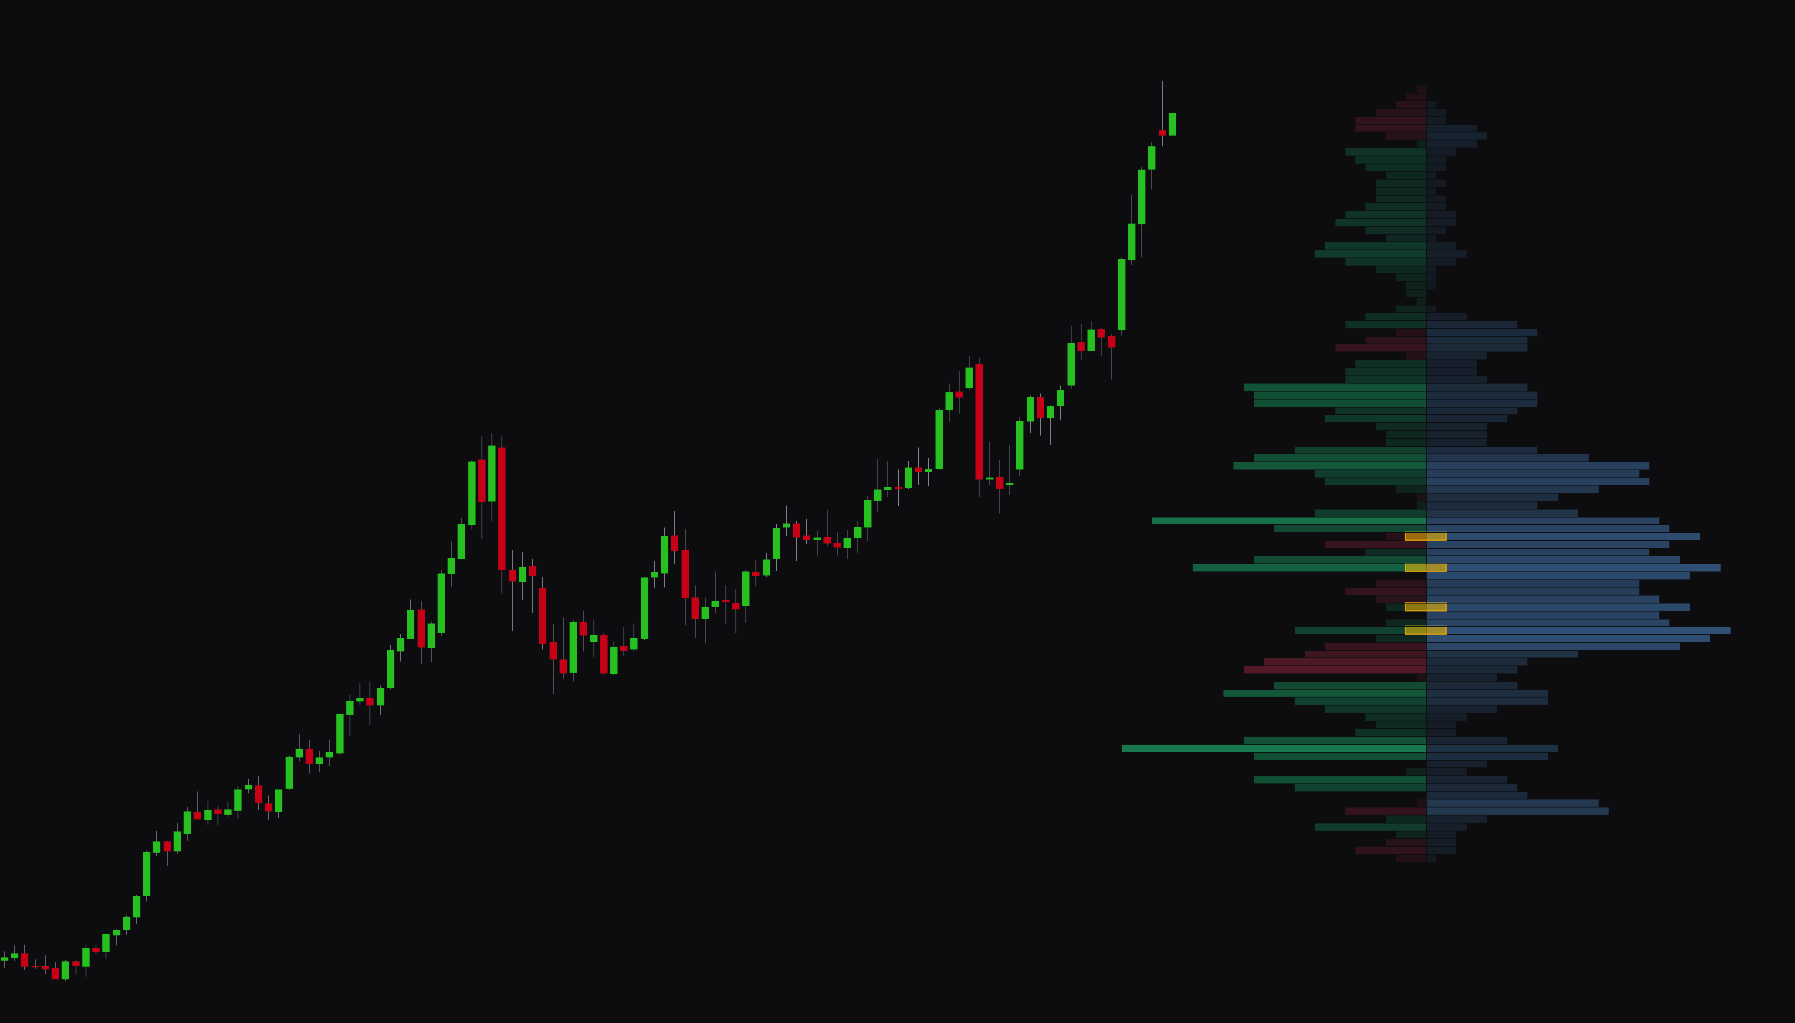
The AI Volume Profile is an institutional tool that shows a butterfly style view of volume distribution across price levels. Unlike traditional volume profiles, it identifies key volume nodes and market imbalances by analyzing buy and sell pressure independently. When you view how volume is distributed horizontally, you can find price levels where institutional interest is highest and where order flow is concentrated.
This tool shows two distinct "wings" to give you a full market view:
- Volume Wing (right side): shows total volume distribution by price level to identify high activity zones.
- Delta Wing (left side): shows the net difference between buying and selling pressure at each price level.
Settings#
You can set the AI Volume Profile to prioritize either recent price action or long term structural volume nodes.
Profile Configuration#
| Setting | Description |
|---|---|
| AI Volume Profile | Enables or disables the butterfly style volume profile view. |
| Lookback Period | Sets the number of historical bars (20 to 500) analyzed for the volume profile calculation. |
| Profile Rows | Sets the vertical resolution (10 to 100) of the price levels in the profile. |
| Width Scale Factor | Controls the horizontal width of the profile wings on the chart. |
| Profile Offset | Adjusts the horizontal distance of the profile from the right edge of the chart. |
Advanced & Technical Settings#
| Setting | Description |
|---|---|
| Premium+ Features | Enables advanced volume calculations using sub 1 minute timeframe analysis. |
| Show AI Key Levels | Highlights volume concentration nodes detected by the algorithm. |
| Show Delta/Volume Wings | Individually toggles the display of the net pressure wing or total volume wing. |
| Adaptive Colors | Dynamically adjusts wing transparency based on volume intensity. |
Best Practices & Usage#
- Identify high volume nodes (HVN): focus on price levels where the Volume Wing is widest. These areas represent prices where the most trading has occurred and often act as support or resistance.
- Spot institutional imbalances: use the Delta Wing to find levels with extreme bullish or bearish net volume. A large bullish delta wing at a specific price suggests institutional accumulation.
- Monitor key level transitions: use the AI Key Levels markers to identify structural shifts in the market. When price breaks through a cluster of key levels, it often signals the start of a new impulse move.
- Adjust for trading strategy:
- Day traders: use a shorter Lookback Period (20 to 100 bars) to focus on intraday volume distribution and current session high volume nodes.
- Swing traders: use a longer Lookback Period (200 to 500 bars) to identify major historical supply and demand zones.
- Confluence with price action: look for a high volume node that also contains a significant delta imbalance. Use these areas to time entries where the "masses" are most active.