AI Heat map
The AI Heat Map is a dynamic visualization tool within the Lune Institutional Analysis suite that provides real-time insights into historical volume distribution. By mapping volume
Overview#
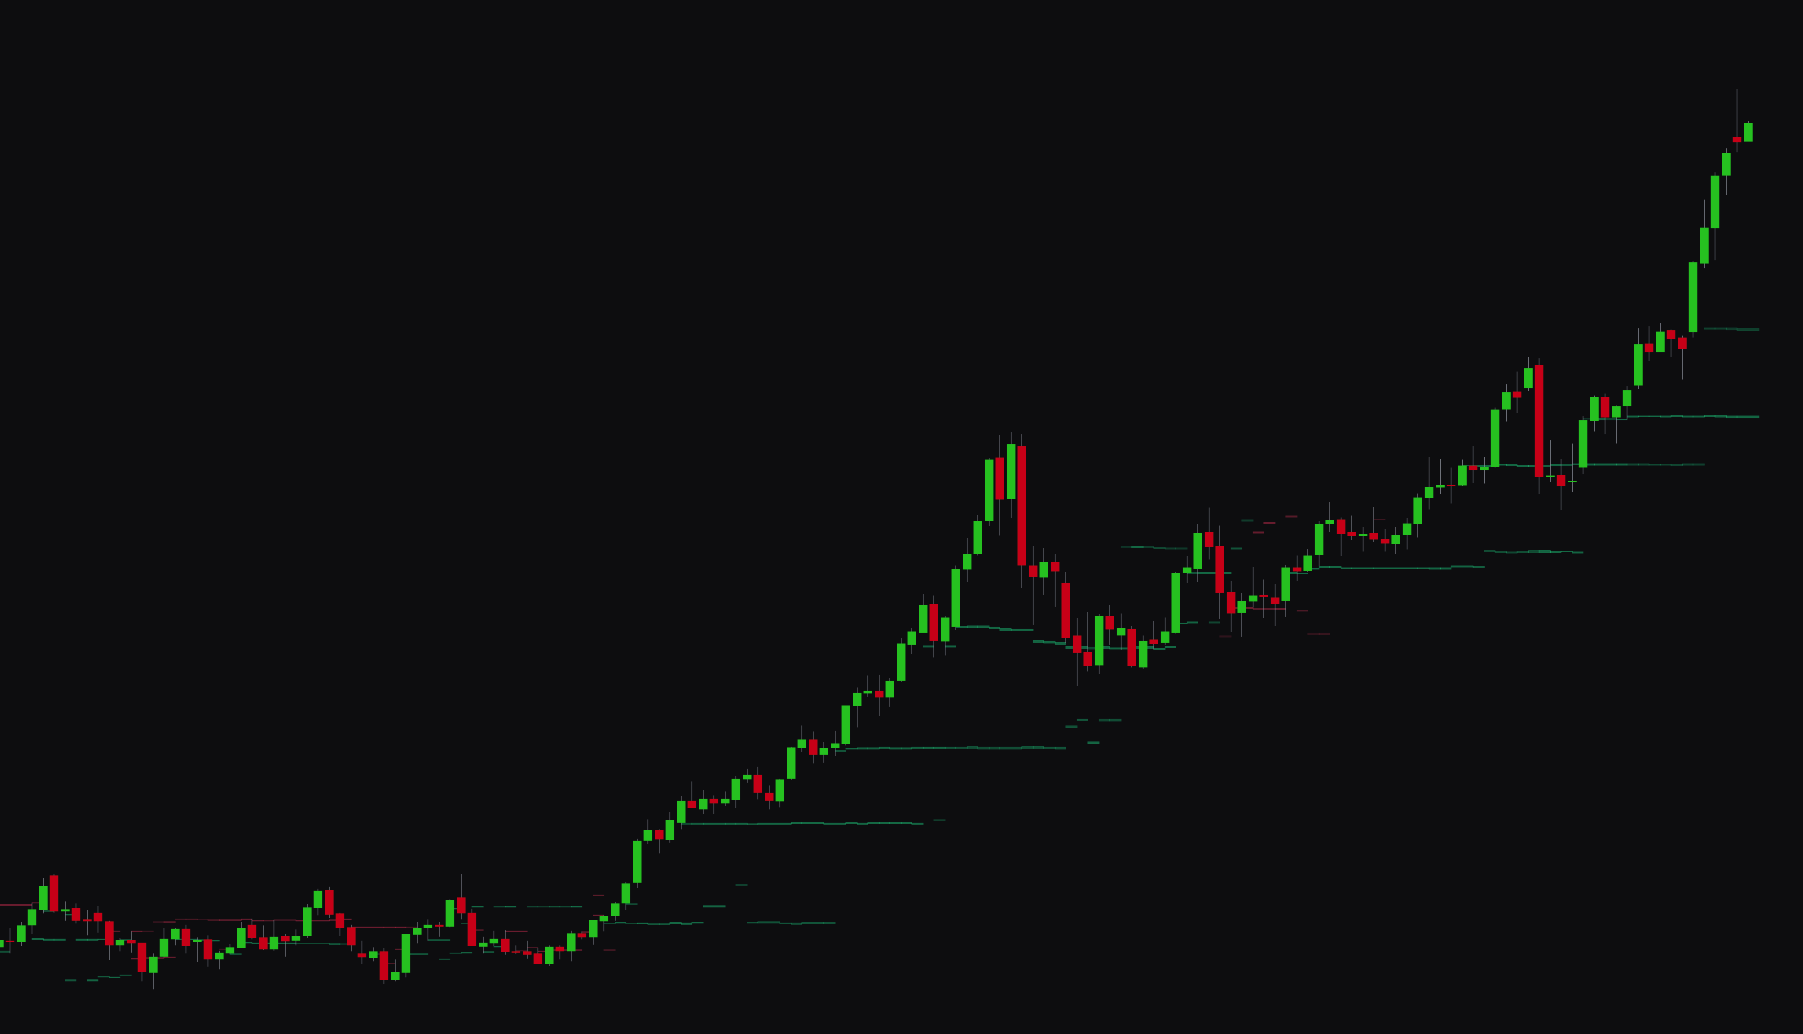
The AI Heat Map is a visualization tool in the Lune Institutional Analysis suite. It gives you real-time insight into historical volume distribution. By mapping volume activity across price levels, it helps you find areas where institutional participants and the broader market are buying or selling.
This feature creates an evolution effect on the chart, where each bar position reflects its own historical volume state. You can choose between data modes, such as total volume activity or buy/sell pressure, to see market interest as color-coded zones that extend across the chart.
Settings#
You can tune the AI Heat Map to prioritize granular detail or long-term structural significance.
Core Configuration#
| Setting | Description |
|---|---|
| AI Heat Map | Turns the volume heatmap visualization on or off. |
| Data Mode | Sets the type of volume shown: Net Volume (total activity), Net Volume Delta (buy vs. sell pressure), or Directional Volume (magnitude with directional bias). |
| Sensitivity | Sets the granularity of level detection (1, 5). A value of 1 gives the smoothest view of the strongest levels, while 5 offers the most detail. |
| Lookback Period | Sets the number of historical bars (5, 200) analyzed to calculate the heatmap. |
Advanced & Visualization Settings#
| Setting | Description |
|---|---|
| Premium+ Features | When on, uses advanced volume calculations based on sub-1-minute timeframe analysis. |
| Levels per Bar | Sets the number of volume zones (1, 5) shown for each analyzed historical bar. |
| Adaptive Transparency | Adjusts zone opacity based on volume significance. The strongest levels appear more opaque. |
| Bull/Bear/Neutral Colors | Sets the colors for bullish pressure, bearish pressure, and neutral volume activity. |
Best Practices & Usage#
- Identify institutional bias: Use the Net Volume Delta mode to see where net buying or selling pressure is concentrated. Opaque bullish zones often show accumulation, while thick bearish zones show distribution areas.
- Monitor zone touches: Watch when the current price interacts with a heatmap zone. These areas often act as real-time support or resistance where large orders are filled.
- Filter market noise:
- Use lower sensitivity (1, 2) for a macro view, showing only the most dominant volume levels over the lookback period.
- Use higher sensitivity (4, 5) for intraday trading to see minor liquidity pockets that may cause short-term price stalls.
- Confirm with alerts: Turn on the Heat Map: Touched alert to get notified when price enters a volume level. This lets you react to institutional activity without watching the screen.
- Strategic lookbacks: Set the Lookback Period to your trading style. Short lookbacks (20, 50 bars) suit immediate momentum, while longer lookbacks (100, 200 bars) help identify major supply and demand zones.