AI & Trend Confluence Strategy
This strategy uses the Lune Market Analysis indicator to identify high-probability trading setups. It is designed to be simple, straightforward, and highly accurate by leveraging C
Overview#
About#
This strategy uses the Lune Market Analysis indicator to identify trading setups. It is designed to be simple and straightforward. It uses Clarity AI, trading signals, and other algorithms to confirm trade entries.

Trading Style#
- Scalp Trading
- Day Trading
- Swing Trading
- Position Trading
Indicator(s) Required#
- Lune Market Analysis
Indicator(s) Settings#
Lune Market Analysis settings
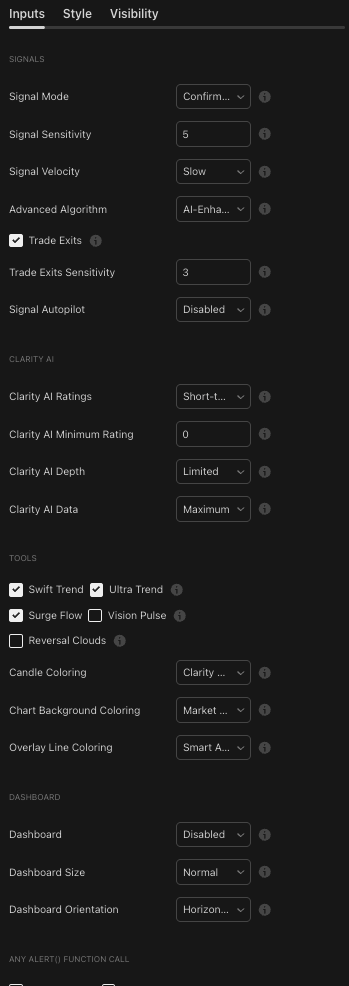
How It Works#
Setup
This strategy is simple and works on any timeframe and any market. Add the indicator to your chart and wait for multiple points of confluence before you enter a trade.
Entering Trade
- Bullish trades: look for a bright green candle, which shows a high Clarity AI score (ideally 2.5 or higher). The color should be vibrant and stand out. Next, confirm that the Swift Trend is also bullish (green) and that the candle trades within or above the Surge Flow. For extra confirmation, the market strength (chart background) should be green and the Smart Activity line should be blue, though these are not required.
- Bearish trades: look for a bright red candle, which shows a high Clarity AI score (ideally 2.5 or lower). The color should be vibrant. Next, confirm that the Swift Trend is also bearish (red) and that the candle trades within or below the Surge Flow. For extra confirmation, the market strength (chart background) should be red and the Smart Activity line should be orange.
Stop Loss
- Bullish trades: set the stop loss at the most recent market low, or exit the trade if the Swift Trend turns bearish (red).
- Bearish trades: set the stop loss at the most recent market high, or exit the trade if the Swift Trend turns bullish (green).
Exiting Trade
- Bullish trades: exit when a "Trade Exit" signal appears, on the next bearish signal, or if the candle color becomes red.
- Bearish trades: exit when a "Trade Exit" signal appears, on the next bullish signal, or if the candle color becomes green.
Step-by-Step Walkthrough#
Bullish Scenario - Example #1#
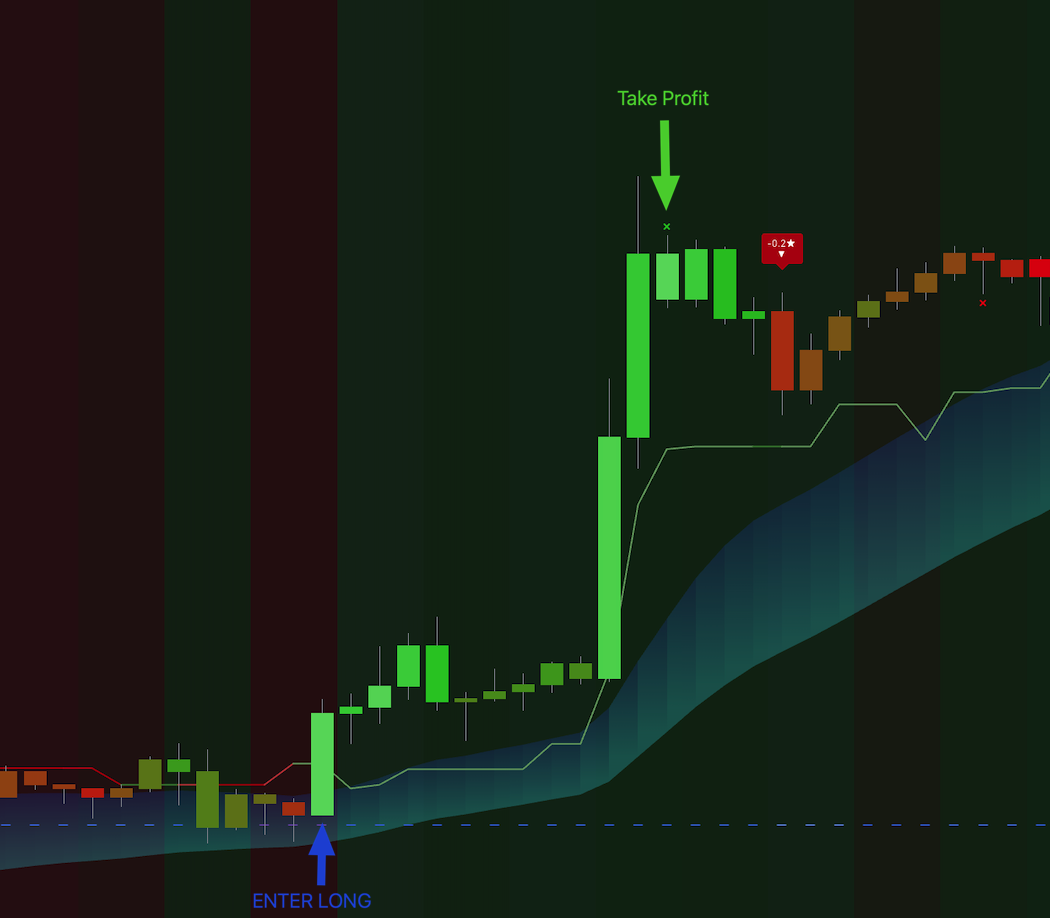
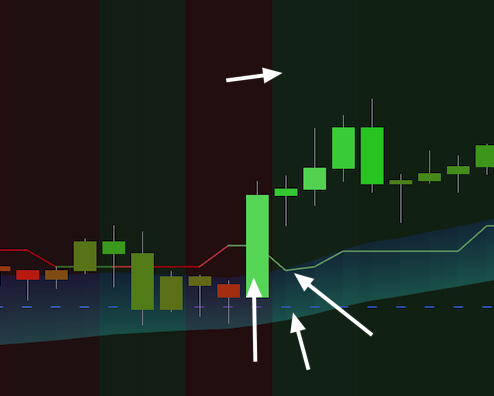
We can see a bullish candle with a high Clarity AI score, shown by the bright green color. The market strength is also bullish (green chart background). The Swift Trend is green, the Surge Flow is bullish, and the price is above it. Smart Activity is also active (blue). Everything aligns in this setup.
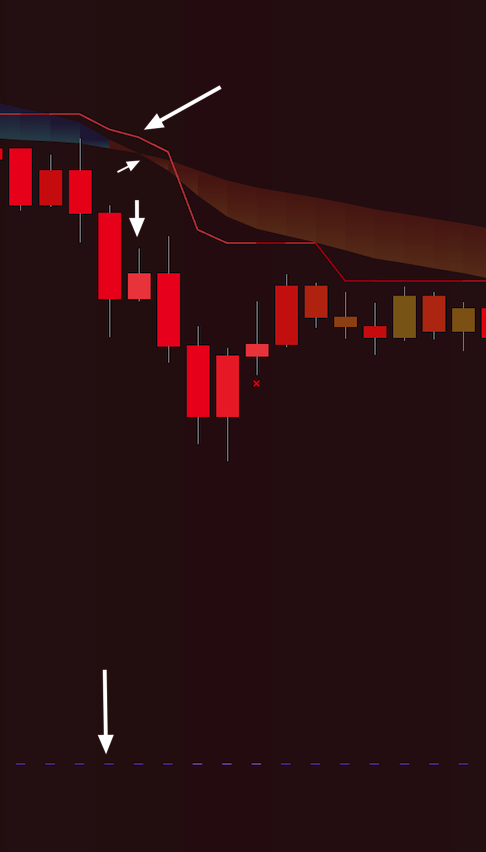
Bearish Scenario - Example #2#
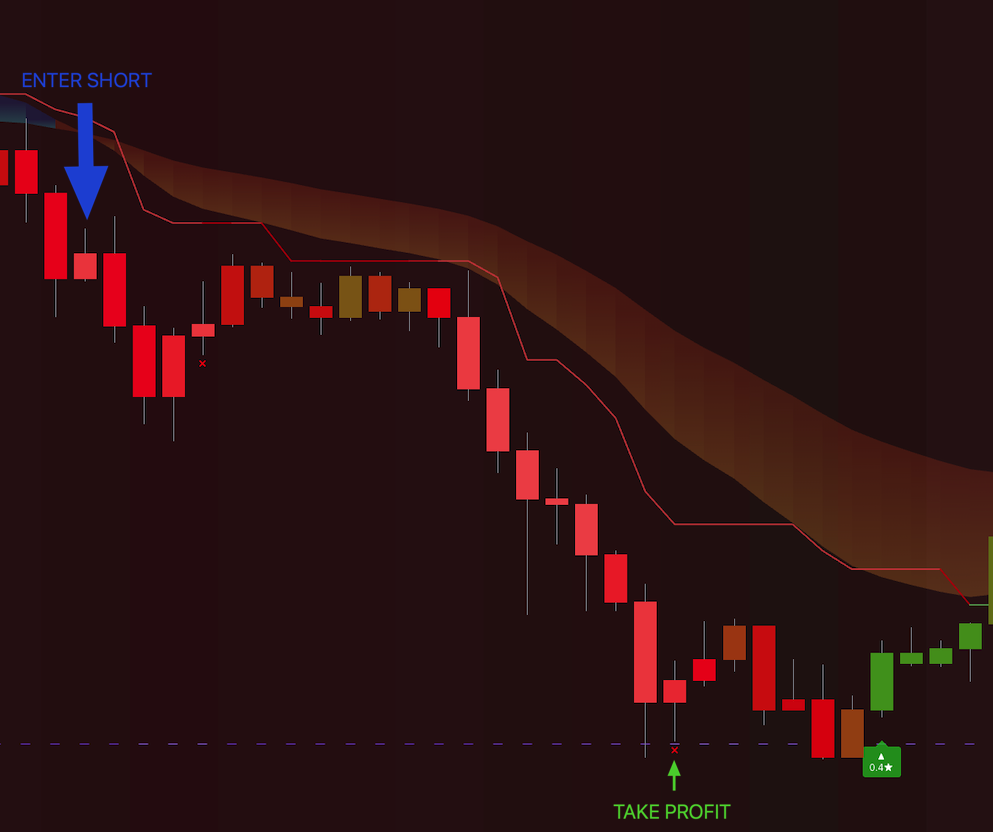
Look for a bearish setup. We can see a bearish candle with a high Clarity AI score, shown by the bright red color. The market strength is bearish (red chart background). The Swift Trend is red, the Surge Flow is bearish, and the price is below it.
Conclusion#
This strategy relies on multiple points of confirmation before you take a trade. When the Clarity AI score, market trend, and momentum all align, you can enter positions with more confidence. The exit rules are clear and help you protect profits and limit losses.