AI & Institutional Activity Strategy
This strategy utilizes both the Lune Market Analysis and Lune Oscillator indicators to identify high-probability trading setups. It is designed to be simple and straightforward, re
Overview#
About#
This strategy uses both the Lune Market Analysis and Lune Oscillator indicators to find trading setups. It is simple and straightforward. It relies on confluence between multiple algorithms to confirm trade entries.

Trading style#
- Scalp Trading
- Day Trading
- Swing Trading
- Position Trading
Indicator(s) required#
- Lune Market Analysis
- Lune Oscillator
Indicator(s) settings#
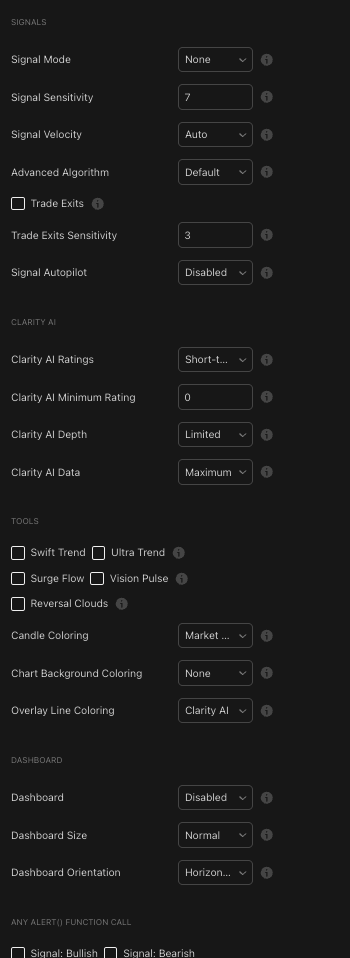
Lune Market Analysis settings
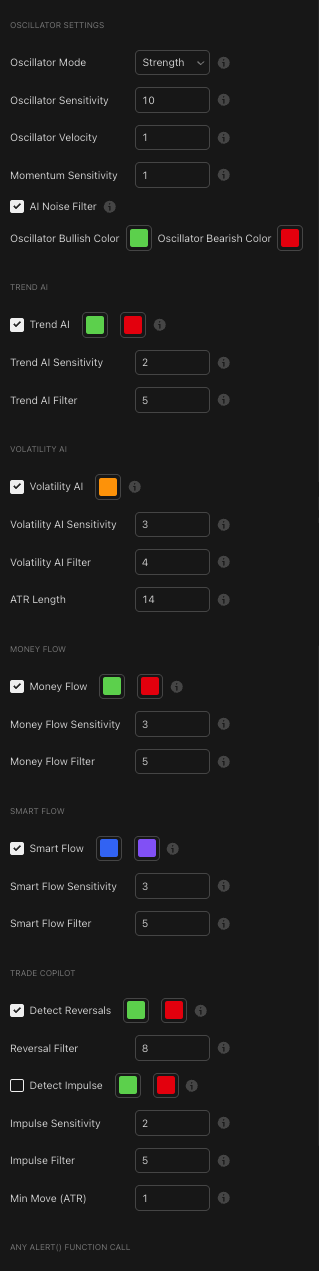
Lune Oscillator settings
How it works#
Setup
This strategy is simple. You can use it on any timeframe and any market. Add both indicators to your chart, then wait for multiple points of confirmation before you enter a trade.
Entering a trade
- Bullish trades: Watch the Lune Oscillator for a bullish Money Flow or Smart Flow signal. Once active, confirm that the Trend AI is also bullish and the Oscillator's Trend line is rising, ideally from a level below or near zero. Then look at the Lune Market Analysis indicator and confirm the Market Trend candle color is bullish (green). For optional setups, confirm the Clarity AI Data overlay line is also bright green.
- Bearish trades: Watch the Lune Oscillator for a bearish Money Flow or Smart Flow signal. Once active, confirm that the Trend AI is also bearish and the Oscillator's Trend line is falling, ideally from a level above or near zero. Then look at the Lune Market Analysis indicator and confirm the Market Trend candle color is bearish (red). For optional setups, confirm the Clarity AI Data overlay line is also bright red.
Stop loss
- Bullish trades: Set the stop loss at the most recent market low. You can also exit if the Lune Oscillator's Trend AI or Volatility AI turns bearish, a bearish reversal is detected, or the Oscillator's Trend line goes below zero.
- Bearish trades: Set the stop loss at the most recent market high. You can also exit if the Lune Oscillator's Trend AI or Volatility AI turns bullish, a bullish reversal is detected, or the Oscillator's Trend line goes above zero.
Exiting a trade
- Bullish trades: Exit if a bearish Reversal is detected, a bearish Money Flow signal appears, or the Trend AI or Volatility AI on the Lune Oscillator turns bearish.
- Bearish trades: Exit if a bullish Reversal is detected, a bullish Money Flow signal appears, or the Trend AI or Volatility AI on the Lune Oscillator turns bullish.
Step-by-step walkthrough#
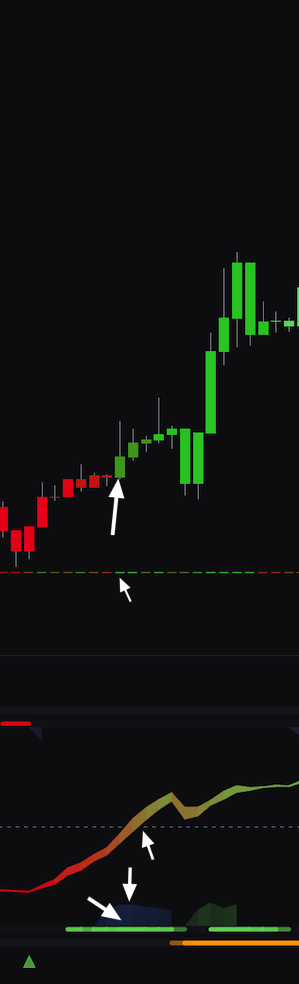
Bullish scenario - Example #1#
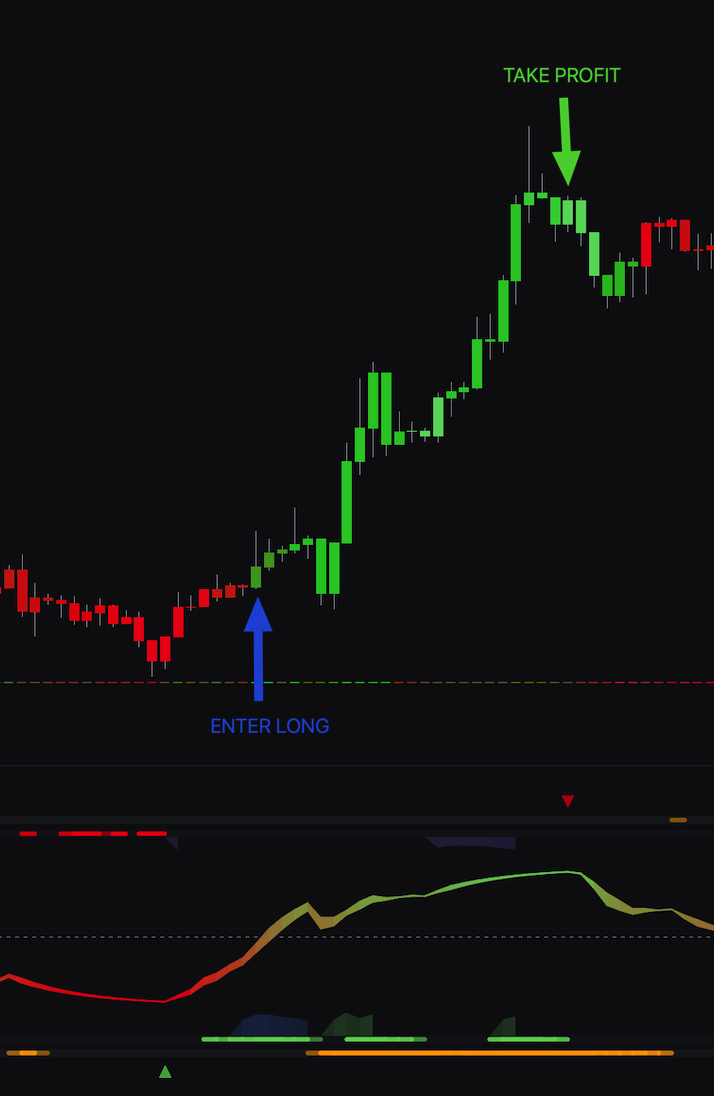
On the Lune Oscillator, the Smart Flow is bullish. The Trend AI is also bullish, and the Oscillator's Trend line is moving up. On the Lune Market Analysis indicator, the candle colors are green, confirming the market trend is bullish. The optional Clarity AI overlay line is also bullish.
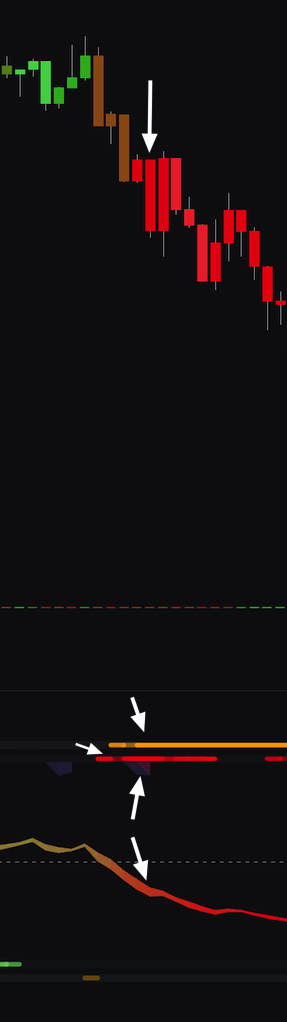
Bearish scenario - Example #2#
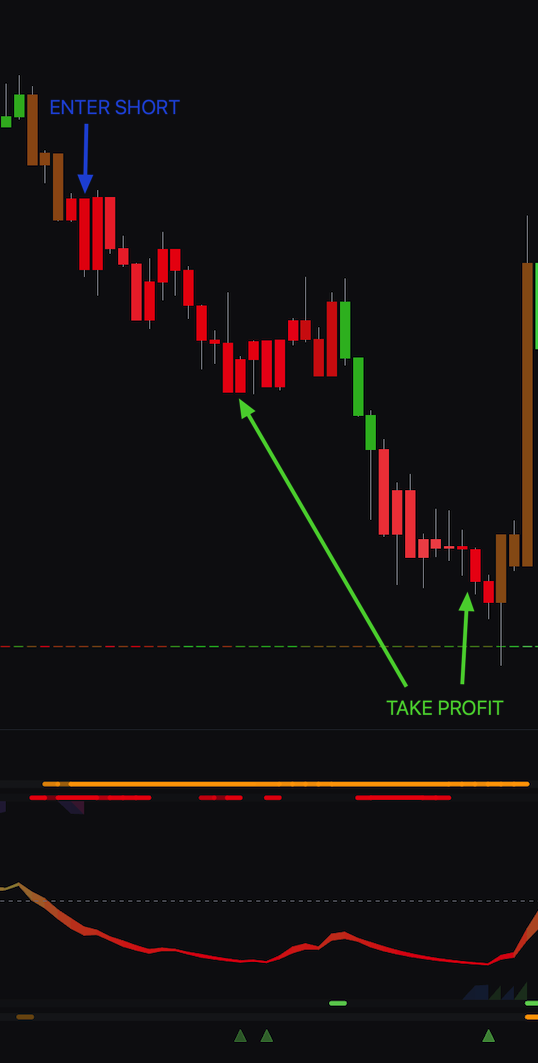
On the Lune Oscillator, the Smart Flow is bearish. The Trend AI and Volatility AI are also bearish, and the Oscillator's Trend line is down. On the Lune Market Analysis indicator, the candle colors are red, confirming the market trend is bearish. The optional Clarity AI overlay line is also bearish.
Conclusion#
This strategy requires confirmation from two separate indicators. When the chart-based signals from Lune Market Analysis align with the momentum and flow signals from the Lune Oscillator, you can enter positions with more confidence. The exit rules are clear and help protect profits while limiting losses.